• Skip to main content
  • Skip to primary sidebar

SpotGamma™

S&P 500 Stock Market Gamma Trading Levels Based on Options Open Interest

  • About
  • Pricing
  • Academy
  • Resources
    • Tool Demos
    • Case Studies
    • Blog
    • Support Center
    • Free Daily Report
    • Free Trading Tools
      • Options Profit Calculator
      • SPX Gamma Exposure
      • Implied Earnings Moves
      • Volatility Ranking
    • Free Training
    • Report Card
  • Login

Mar 08 2020

March ’20 Nomura Gamma

Great post from Heisenberg about Nomura and SocGen Gamma reports below. This chart went up on Thursday 3/5 – here is the SpotGamma gamma chart for reference:
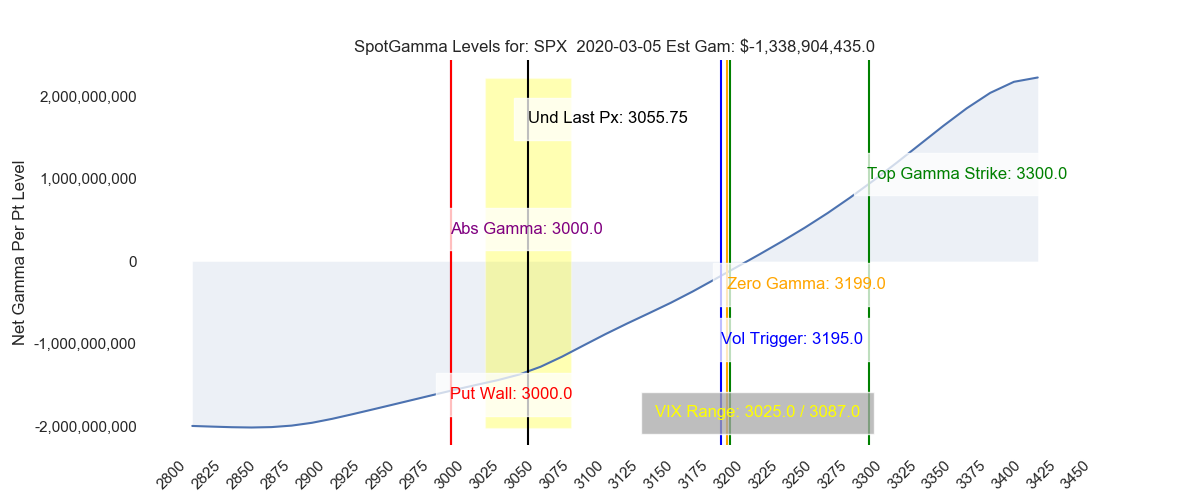
spotgamma march 5th spx index market gamma report showing negative gamma
SpotGamma SPX Market Gamma Graph

In “We’re All Momentum Traders Now”, I spent quite a bit of time attempting to drive home one overarching point: Directional moves over the past two weeks have been amplified materially by gamma hedging flows, and that amplification is part and parcel of a feedback loop that can turn steep selloffs into outright routs.

This is familiar territory to regular readers. Hopefully, it will be well understood by all market participants at some point in the future, but I’m not optimistic about that.

The amusing reality of the situation was captured succinctly on Thursday by Nomura’s Charlie McElligott, who wrote that “even traders who view themselves as ‘fundamental’ or discretionary are in the same boat as ‘momentum’/ ‘negative convexity’ players”. Why? Well, because, as Charlie went on to emphasize, “we ALL operate under frameworks which allow for greater leverage deployment into trending markets, and conversely, dictate de-grossings into ‘VaR-events’”.
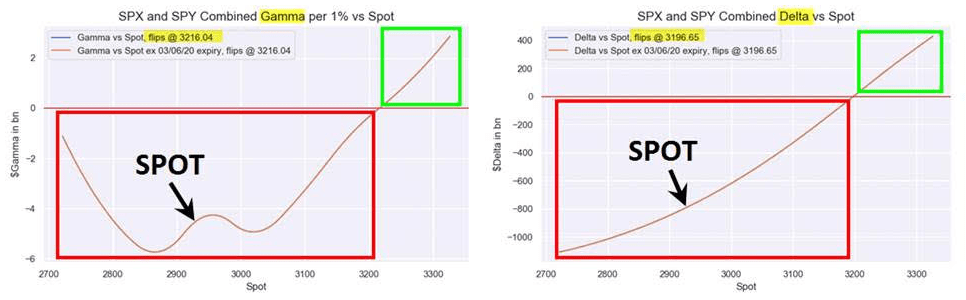
Nomura SPX gamma report 2020
March 2020 Nomura Gamma Report

This dynamic – wherein directional moves are everywhere and always amplified by dealer hedging when gamma flips to the “dark side”, as it were – is likely to persist. “The gamma ‘breakeven’ remains painfully far away… before we are back in a ‘neutral’ position again which would contribute to ‘tighter’ ranges as the hedging behavior ‘compresses’”, McElligott said Friday.

The size of vol.-selling flow for yield generation “has increased to such an extent that the hedging of these options has started to impact the index price itself”, he writes, before noting that on the bank’s estimates, “the flows from option gamma hedging can account for 10-15% of total daily volumes on index futures”.

After reiterating the basic concept (i.e., that “under normal conditions, hedging activity dampens market volatility… but in circumstances when total option gamma turns negative, hedging activity exacerbates market moves) he rolls out the following visual which illustrates the dynamic as it operated during the worst week for US equities since the crisis.

(SocGen explains: “Chart shows the distance from the gamma transition threshold — speed —  vs the subsequent day absolute index return in %. Large moves in spot occur mostly during periods of negative gamma”)

“In the selloff in the last week of February 2020, option hedging continued to amplify volatility both on the upside and the downside”, Cassot writes

socgen positive gamma negative gamma speed
SocGen Gamma Speed

Want Daily Gamma Levels?

Sign up to SpotGamma’s subscriber service now.

Share This Article

  • Share
  • Twitter
  • LinkedIn
  • Reddit
  • Facebook

Written by tenten · Categorized: Market Analysis · Tagged: gamma chart, mcelligott, nomura, socgen, speed index

Don’t have an account with SpotGamma?

Choose the plan you want today to view unique support and resistance levels, access Founder’s Notes and expert commentary, daily trading ranges, and entrance into our private Discord.


Primary Sidebar

Related Resources

  • Welcome to the Summer Melt-Up

    Welcome to the Summer Melt-Up

    August 9, 2026
  • The Machine Ran on Call Skew: What MSTR’s Dead Volatility Surface Says About Strategy — and Bitcoin’s Missing Bid

    The Machine Ran on Call Skew: What MSTR’s Dead Volatility Surface Says About Strategy — and Bitcoin’s Missing Bid

    August 3, 2026
  • The New Normal in Volatility Takes Shape

    The New Normal in Volatility Takes Shape

    August 2, 2026
  • Anatomy of a Margin Call: How Situational Awareness LP Unwound a $20 Billion AI Book in One Trade

    Anatomy of a Margin Call: How Situational Awareness LP Unwound a $20 Billion AI Book in One Trade

    July 30, 2026
  • Big Tech Earnings and FOMC Collide

    Big Tech Earnings and FOMC Collide

    July 26, 2026
  • youtube
  • x
  • Privacy Policy
  • Disclaimer
  • Terms & Conditions
  • Support Center
  • Media
  • Contact Us

©2026 TenTen Capital LLC DBA SpotGamma

All SpotGamma materials, information, and presentations are for educational purposes only and should not be considered specific investment advice nor recommendations. Futures, foreign currency and options trading contains substantial risk and is not for every investor. An investor could potentially lose all or more than the initial investment. Risk capital is money that can be lost without jeopardizing one's financial security or lifestyle. Only risk capital should be used for trading and only those with sufficient risk capital should consider trading. Past performance is not necessarily indicative of future results. Testimonials appearing on this website may not be representative of other clients or customers and is not a guarantee of future performance or success.

View Full Risk Disclosure