• Skip to main content
  • Skip to primary sidebar

SpotGamma™

S&P 500 Stock Market Gamma Trading Levels Based on Options Open Interest

  • About
  • Pricing
  • Academy
  • Resources
    • Tool Demos
    • Case Studies
    • Blog
    • Support Center
    • Daily Report
    • Free Trading Tools
      • Opening Setup Free Report
      • Options Profit Calculator
      • SPX Gamma Exposure
      • Implied Earnings Moves
    • Free Training
    • Report Card
  • Login

socgen

Mar 08 2020

March ’20 Nomura Gamma

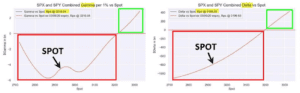
Charts of SPX and SPY combined gamma and delta vs spot, red boxes around negative SPOT, green on positive ends.

Great post from Heisenberg about Nomura and SocGen Gamma reports below. This chart went up on Thursday 3/5 – here is the SpotGamma gamma chart for reference: In “We’re All Momentum Traders Now”, I spent quite a bit of time attempting to drive home one overarching point: Directional moves over the past two weeks have […]

Written by tenten · Categorized: Market Analysis · Tagged: gamma chart, mcelligott, nomura, socgen, speed index

Dec 05 2019

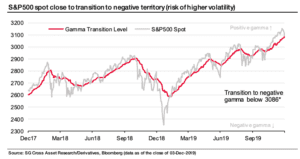
SocGen Zero Gamma Chart History

Line chart of S&P500 spot and gamma transition level from Dec 2017 to 2019 noting negative gamma below 3086.

Here is a backtest of where SocGen calculates where positive gamma changes to negative gamma in the S&P500 (SPY). You can view our historical chart here. The concern is that a move through the zero gamma level may set a “gamma trap“. Our FAQ has more information: Zero Gamma Level: This is the estimated level […]

Written by SpotGamma · Categorized: Market Analysis · Tagged: chart, gamma trap, history, socgen, zero gamma

Dec 04 2019

SocGen: November 2019 Largest Positive Gamma Ever
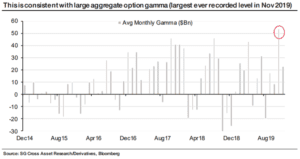
Bar chart of average monthly gamma in billions of dollars from Dec 2014 to 2019, red circle highlighting the highest bar.

We had recorded extreme readings as well, but our data didnt go back nearly this far.

Written by SpotGamma · Categorized: Market Analysis · Tagged: positive gamma, socgen

Primary Sidebar

SpotGamma-Subscriber-Signup-Banner

  • ORCL Insider Buying: Director Makes $3.5 Million Bet as Options Market Signals Caution
  • Delta Earnings Preview: Options Price a Meaningful Move as Fuel Costs Test the Bull Case
  • Last Call: Relatively Few Traders Are Hedging Equity Downside
  • LEAPS Options: Long-Term Exposure With Less Capital
  • Covered Calls: The Complete Guide to Selling Calls Against Stock
  • youtube
  • x
  • Privacy Policy
  • Disclaimer
  • Terms & Conditions
  • Support Center
  • Media
  • Contact Us

©2026 TenTen Capital LLC DBA SpotGamma

All SpotGamma materials, information, and presentations are for educational purposes only and should not be considered specific investment advice nor recommendations. Futures, foreign currency and options trading contains substantial risk and is not for every investor. An investor could potentially lose all or more than the initial investment. Risk capital is money that can be lost without jeopardizing one's financial security or lifestyle. Only risk capital should be used for trading and only those with sufficient risk capital should consider trading. Past performance is not necessarily indicative of future results. Testimonials appearing on this website may not be representative of other clients or customers and is not a guarantee of future performance or success.

View Full Risk Disclosure