From Zerohedge we see some nice Gamma related research from Morgan Stanley. Posted below is their note.
By Chris Metli of Morgan Stanley Quantitative Derivative Solutions
The March 2020 equity selloff ushered a huge volatility shock that caused unprecedented losses for short volatility strategies. The impact is likely bigger than just a one-time hit to P/Ls though – after these losses, volatility sellers have pulled back, and it will take a long time for new strategies to form and for assets to grow.
Lower volatility supply has broad implications because it threatens to break the positive feedback loop that boosted markets over the last few years: volatility selling put dealers into long gamma positions, which dampened realized volatility, which drove buying from vol target investors (and allowed greater leverage for investors of all stripes).
This was the third material event for vol sellers in two years (Feb 18, Dec 18, and Mar 20) – after each event one type of strategy was knocked out, and volatility supply migrated to another area:
- Feb 2018 – In the 6 months prior to the VIX blowup retail was selling ~$12mm vega a month via VIX ETPs, but the near-death experience for VIX ETPs on Feb 5th 2018 killed that trade.
- Dec 2018 – In 2018 iron condor selling strategies likely sold $20bn notional of condors a month and average net gamma supply in S&P 500 options was ~$13bn per month from April through September, but the December 2018 selloff forced most of the condor funds to lock in losses on the lows and AUM fled.
- March 2020 – In 2019 the dominant vol supply came from more active strategies that tended to more dynamically manage exposures, but some were forced to lock in losses on the lows as strategies were risk managed.
The risk is that after this latest (and largest) event, asset owners still looking for short volatility exposure may have few places to turn to in the near-term. Vol fell quickly from its March peak, but that pace of decline can’t be extrapolated into the future. Forced unwinds of short vol positions caused a supply/demand imbalance and vol spike that was unsustainable – then opportunistic sellers came in, the unwinds stopped, and vol fell sharply. But those opportunistic traders are not dedicated vol sellers and won’t stay for the long haul – further declines in vol will require dedicated, systematic sellers who regularly supply vol to the market to come in. They will be back (in fact this is a great time for the strategy given less supply now, a theme the MS Cross Asset Strategy team has highlighted in Overwrite Across Asset Classes from Apr 22nd 2020) – but that base of dedicated vol sellers will be slow to build, which means that volatility declines more slowly from here, which means that systematic strategy re-leveraging will come more slowly as well.
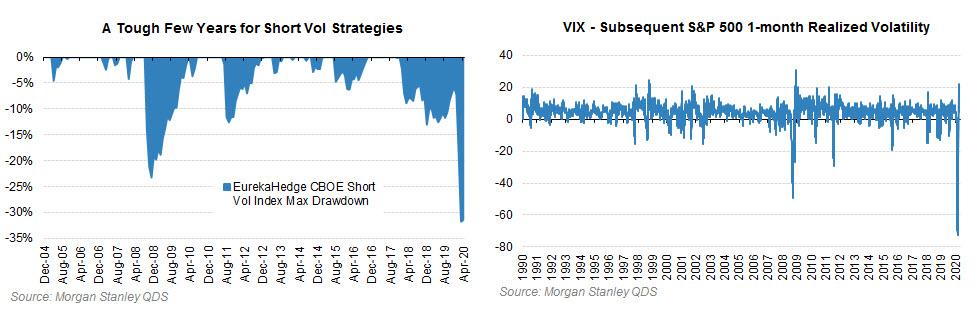
History shows that supply/demand dynamics usually shift after volatility spikes – after major turning points in volatility the implied-realized spread usually remains elevated for a few years before falling back to pre-shock levels (i.e. implied volatility does not fall as fast as realized vol does). On the demand side some investors hedge more on fears of a repeat of the recent past, while on the supply side there are usually fewer volatility sellers as capital generally follows positive returns, not losses. While it is still early in this episode, over the last month the magnitude of the gamma supplied to the market has been modest, suggesting a similar pattern is developing.
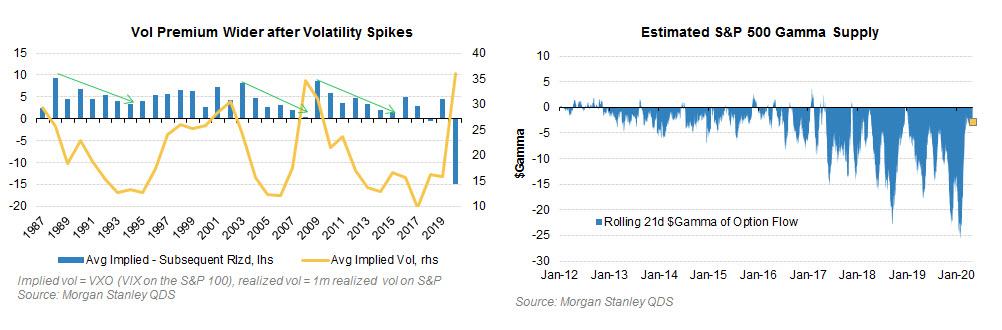
And it’s not just outright vol sellers that suffered in March – relative value vol strategies that use SPX as the funding leg (i.e. selling SPX volatility) to either buy single-name vol (i.e. dispersion trades) or buy volatility on non-US indices suffered as well. This forced covering of the short SPX vol leg, but the bigger issue is that many strategies have been forced out of the market, so there is now less capital able to take advantage of the fact that the correlation between single-names implied by the S&P 500 options market is in the 95th %ile or S&P 500 volatility that trades 5 vols over rest-of-world averages. With it harder to recycle the volatility selling that occurs outside the US via autocallable products back into the larger US market, the relative cheapness of ex-US vol (driven by greater local vol supply) relative to S&P 500 vol could be sustained for some time (ask for more details on autocallables).
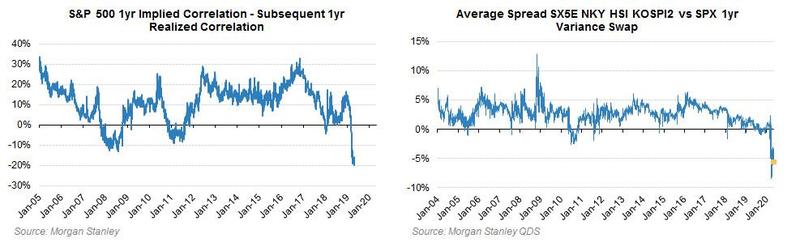
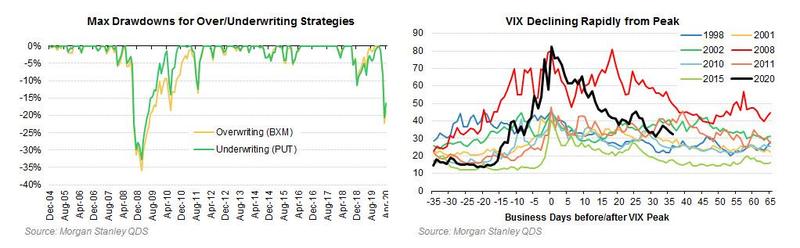
A natural question is how did VIX fall by over 50% if there are no vol sellers after March? It’s not that there are no sellers – there has been plenty of opportunistic vol selling. But those traders have now made the easy money and many won’t stick around for long. To drive volatility back to ‘normal’ levels i.e. sub-20 on the VIX, the market needs steady, regular supply from dedicated players. Many ‘simpler’ strategies like vanilla overwriting or underwriting actually fared better in March than they did in 2008, in contrast to the industry performance shown in the first chart above – and those strategies will attract assets – but that flow takes time to build, and as a result volatility will be slow to fall.
There are of course other market dynamics besides vol supply at play, some that support higher realized vol and some that suggest vol should be lower. Reduced near-term buybacks and lower liquidity are similar to having less vol supply in that they should contribute to higher realized vol. On the other side is the large and growing Fed put (even if that strike is farther OTM after this rally) and the fact that the demand for volatility is down as well. One large regular VIX call buyer has publically said they would step aside until volatility declines meaningfully, while other large buyers of S&P 500 downside have generally been monetizing hedges since March, not adding to them.
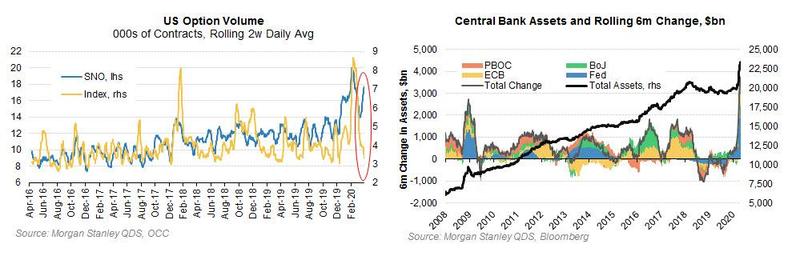
Volumes in index options (including VIX) are down sharply as a result of the simultaneous decline in supply and demand. To be clear QDS is not arguing for higher volatility here given some of those offsets – but rather making the case that it should take a while for volatility to fully normalize from current levels.
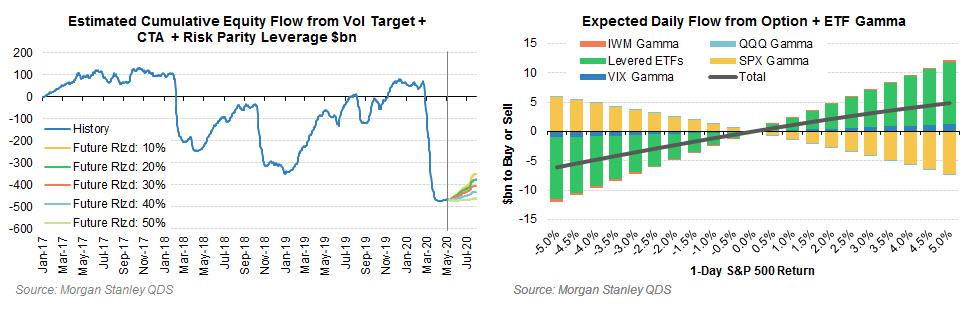
A slower decline in volatility means that leverage from systematic strategies (Vol Target Funds, CTAs, Risk Parity Funds) should be slow to build. Those investors sold over $500bn in global equity from late Feb through early April, and while that will need to be bought back at some point, but lower volatility is required to drive reinvestment. It took almost two years after August 2015 for these investors to build back to peak leverage, and one year after December 2018.
This rebuild could be slower because the feedback mechanism is broken: over the last 10 years the pattern has been:
- investors sell options ->
- dealers are put into a long gamma position ->
- which suppresses realized volatility as dealers sell rallies and buy dips ->
- which allows systematic strategies to lever up since most models are driven by realized vol.
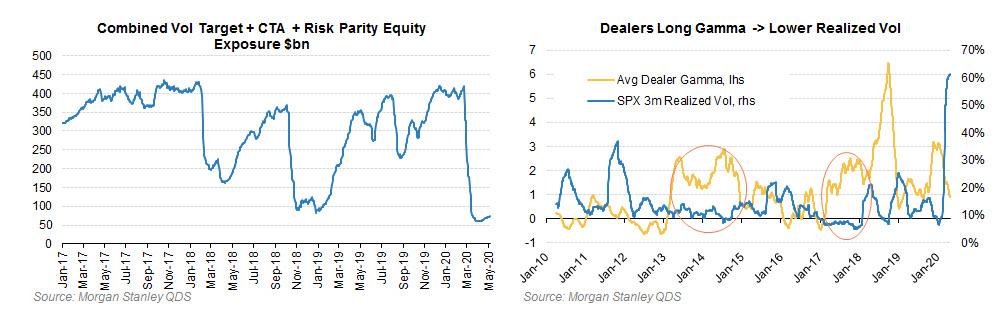
QDS forecasts that demand over the next three months from systematic strategies would average $1bn / day at 30% realized volatility (in-line with VIX), $1.5bn / day at 20% realized volatility, and $2bn / day at 10% realized volatility. The 20% to 30% range is much more likely in QDS’s view than the 10% case, and investors should not expect too much demand from systematic strategies in the near-term (although positioning is light more broadly as well, and discretionary investors could be buyers). Lower volatility supply also means dealer gamma positions will be on the smaller side (a few $bn / 1%) which likely means the market on net should remain slightly short gamma due to the levered ETF balances (short about $1bn / 1% on net).