Through an options market lens, the following text will add color to some recent market movements.
long gamma
Morgan Stanley VIX & SPX Market Gamma Update
From Zerohedge we see some nice Gamma related research from Morgan Stanley. Posted below is their note. By Chris Metli of Morgan Stanley Quantitative Derivative Solutions The March 2020 equity selloff ushered a huge volatility shock that caused unprecedented losses for short volatility strategies. The impact is likely bigger than just a one-time hit to […]
SPY Gamma Visualization
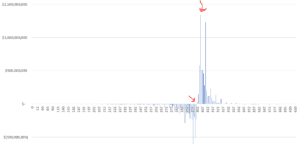
Below is a chart of gamma across all strikes in SPY. You can see that there is a large amount of gamma supply at 305 (right most arrow) and gamma flips from positive to negative around 301. It is below that strike where our model predicts increased volatility as dealers go from buyers to sellers. […]
Short Gamma vs Long Gamma
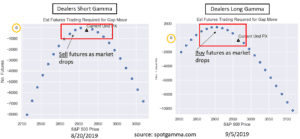
As dealers were short gamma for most of August they have moved to long gamma. Below is a chart comparing their theoretical behavior in each gamma regime. You can see when dealers are short gamma and the market is falling they are trading with the market, fueling the drop. Conversely when long gamma they are […]
Long Gamma Kick Save 8/30/2019
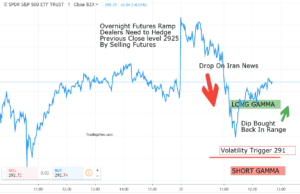
There have been lots of short gamma charts lately but today’s action looked like a long gamma kick save. News about Iranian enrichment pushed the market down at ~11EST and there was a decent drop to ~291 – a dip that was bought. The previous close was 292.5 and we model that because of the […]
FED, TRUMP, Gamma Trap: Crazy Trading Day 8/23/19
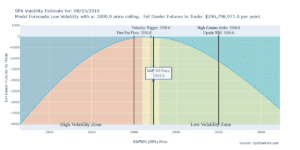
Fed gave a speech that was “volatility dampening” at 10AM. Trump didn’t like what the Fed had to say so he started tweet-trashing the Fed and China triggering a “gamma trap“. Stock markets were just at the volatility trigger level of 2920 (black horizontal line) so the gap down flipped the trigger and dealers were […]
