From Heisneberg we get a glimpse into Nomuras gamma view, which seems to coincide with what we see. Namely gamma is about as high as we’ve ever seen, this past week hitting $2.7 billion compared to an all time high of ~$2.9bn in August of 2018.
At the same time, investors have leaned into equities upside amid the trade-inspired euphoria. McElligott breaks this down beyond the obvious, noting that in addition to CTA trend showing “+100% Longs” again in global equities futures, the vol. sellers and overwriters are back “and very active with consolidated SPX/SPY options $Gamma at 94.1%ile since 2013”. Charlie also notes that “investors are EXTREMELY ‘long’ via options (and the stock rally/appreciation), with SPX/SPY consolidated $Delta at 98%ile since 2013”.

While all this looks like a signal for a market top McElligott states this doesn’t mean he sees a top in the market because corporate buybacks and possibility that Trump cuts a deal.
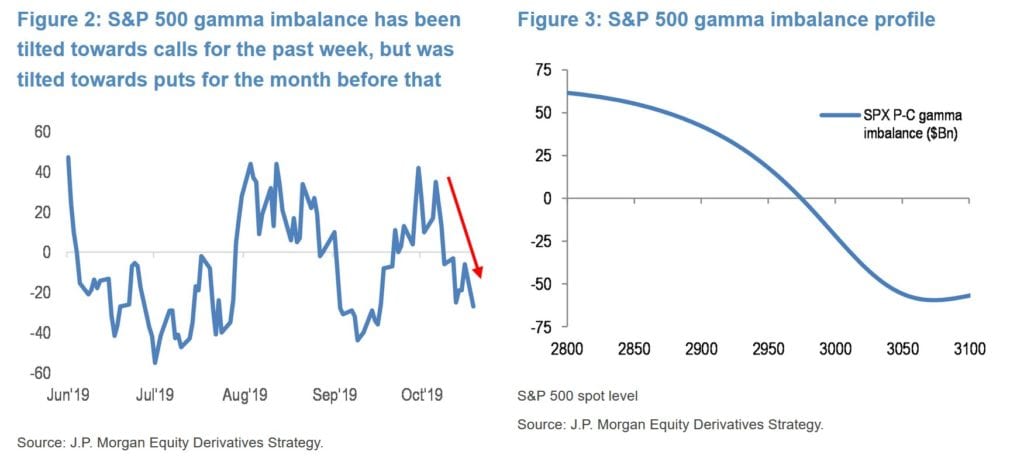
We’d also note that a few weeks ago JPM showed that their gamma tilt (put gam:call gamma) was at extremes, but that figure (according to the ratio we track) has only gone more extreme. Note the chart on the left is dated to late October and we further tracked that ratio continuing to lows as seen in Sep’19.

SpotGamma has started tracking Call/Put Gamma Tilt for subscribers.
