• Skip to main content
  • Skip to primary sidebar

SpotGamma™

S&P 500 Stock Market Gamma Trading Levels Based on Options Open Interest

  • About
  • Pricing
  • Academy
  • Resources
    • Tool Demos
    • Case Studies
    • Blog
    • Support Center
    • Free Daily Report
    • Free Trading Tools
      • Options Profit Calculator
      • SPX Gamma Exposure
      • Implied Earnings Moves
      • Volatility Ranking
    • Free Training
    • Report Card
  • Login

mcelligot

Mar 04 2021

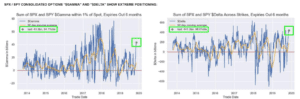
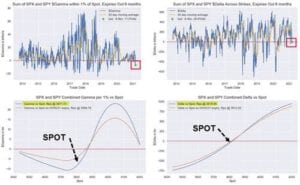
Nomura: “Max Short Gamma” Pain… But Relief Is Coming

SPX gamma_0

Via ZH: Earlier this week we pointed out a bizarre divergence in the “greeks” – while the Nasdaq had slumped into negative gamma territory, which is where dealers are forced to sell more as the Nasdaq slides lower creating a feedback loop where selling begets selling, even as the S&P still remained in positive gamma […]

Written by developer · Categorized: Market Analysis · Tagged: mcelligot, negative gamma, nomura, QQQ

Feb 04 2021

Nomura’s McElligott: ‘The VIX Is Broken — Again’

From Heisneberg: “From a Vol market perspective, the issue is that the VIX is broken — again,” Nomura’s Charlie McElligott said Monday, in one section of a sweeping note documenting recent dynamics and detailing what a trio of backtests might foretell for markets on the heels of last week’s somewhat deranged developments. It’s “all demand” […]

Written by SpotGamma · Categorized: Market Analysis · Tagged: mcelligot, nomura, VIX

Nov 15 2019

Nomuras November Gamma Report

From Heisneberg we get a glimpse into Nomuras gamma view, which seems to coincide with what we see. Namely gamma is about as high as we’ve ever seen, this past week hitting $2.7 billion compared to an all time high of ~$2.9bn in August of 2018. At the same time, investors have leaned into equities […]

Written by SpotGamma · Categorized: Market Analysis · Tagged: gamma, mcelligot, nomura

Aug 12 2019

SpotGamma Trading Levels Vs Nomura

Here is a report from Nomura compared to the same days market forecast from SpotGamma.com. Notice the “zero gamma” levels are the same in both reports at 2935 in the S&P500. We call the “zero gamma” level “volatility trigger”. Using this level can help forecast the level of stock market volatility. Under this market price […]

Written by tenten · Categorized: Gamma Model Output, Market Analysis · Tagged: market gamma, mcelligot, nomura, volatility flip

Primary Sidebar

SpotGamma-Subscriber-Signup-Banner

  • Options Exchange Monitor — Week of August 15, 2026 (36 SEC notices, 2 CFTC, 0 EDGAR)
  • GEX Levels for SPY, QQQ, ES and NQ: Using Index Gamma in Any Product
  • How to Trade GEX Levels: A Practical Guide to Gamma-Based Trading
  • Free GEX Levels, Charts, and Data: What’s Available and What It’s Actually Worth
  • Covered Calls After Assignment: What to Do When the Stock Drops Below Your Cost Basis
  • youtube
  • x
  • Privacy Policy
  • Disclaimer
  • Terms & Conditions
  • Support Center
  • Media
  • Contact Us

©2026 TenTen Capital LLC DBA SpotGamma

All SpotGamma materials, information, and presentations are for educational purposes only and should not be considered specific investment advice nor recommendations. Futures, foreign currency and options trading contains substantial risk and is not for every investor. An investor could potentially lose all or more than the initial investment. Risk capital is money that can be lost without jeopardizing one's financial security or lifestyle. Only risk capital should be used for trading and only those with sufficient risk capital should consider trading. Past performance is not necessarily indicative of future results. Testimonials appearing on this website may not be representative of other clients or customers and is not a guarantee of future performance or success.

View Full Risk Disclosure