Daily Note:
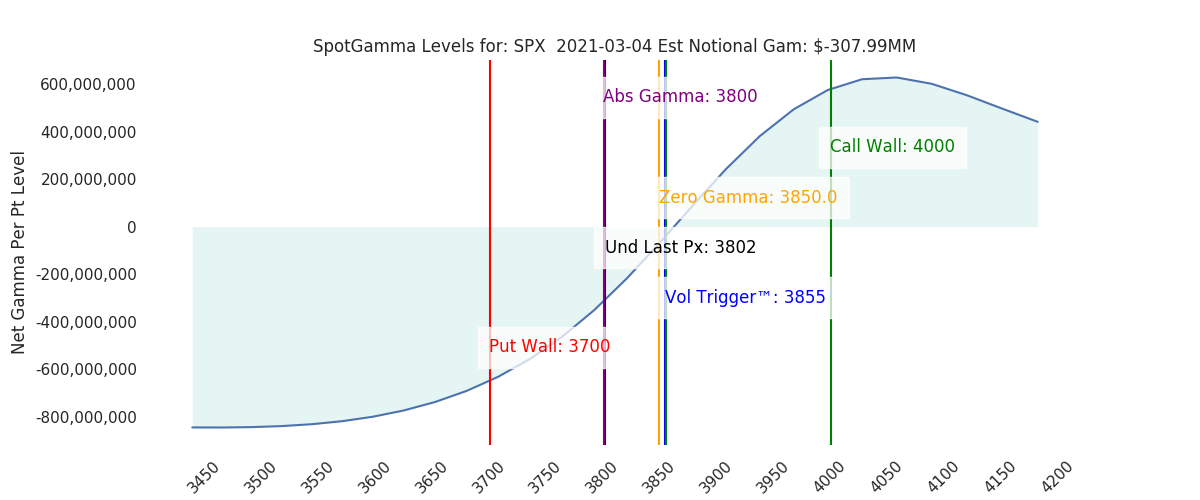
Futures are holding 3800 after making a 3780 low overnight. Gamma is negative across all indicies indicating a large trading range is in store today. The largest gamma strike has shifted from 3900 to 3800, which is again highlighted as our critical support mark. We feel a push below that 3800 level likely energizes put positions and draws dealer short hedges. Beneath 3800 we see two support levels: 3728 (Combo Strike) and 3700(Put Wall).
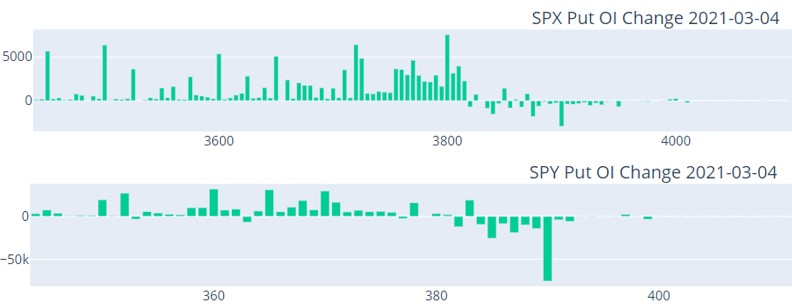
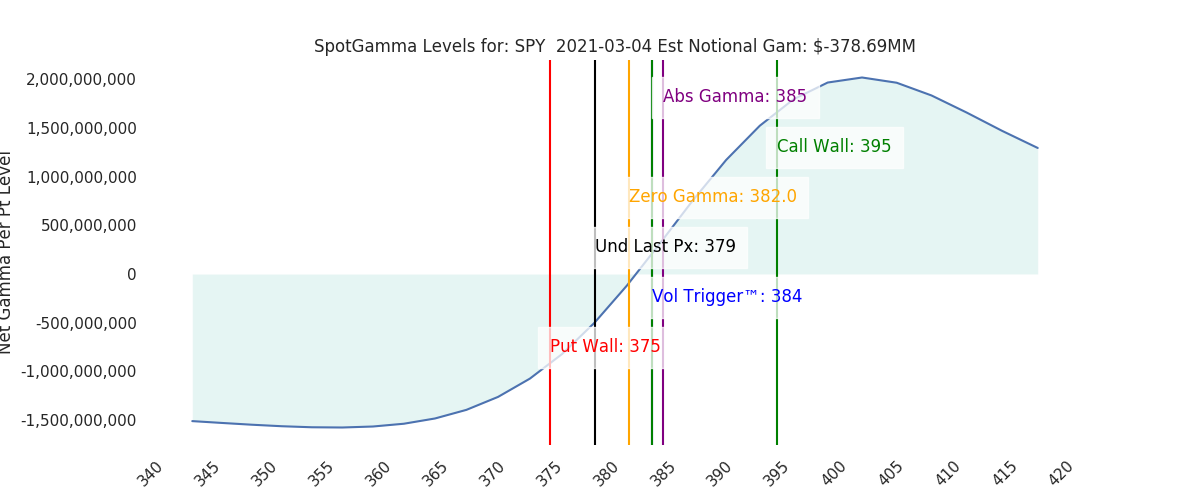
Traders used yesterdays drawdown to net close put positions >=3820 in SPX and 384 in SPY. Recall in last nights note that the SPX volume was tilted towards calls yesterday. Combined, this suggests little real demand for downside protection.
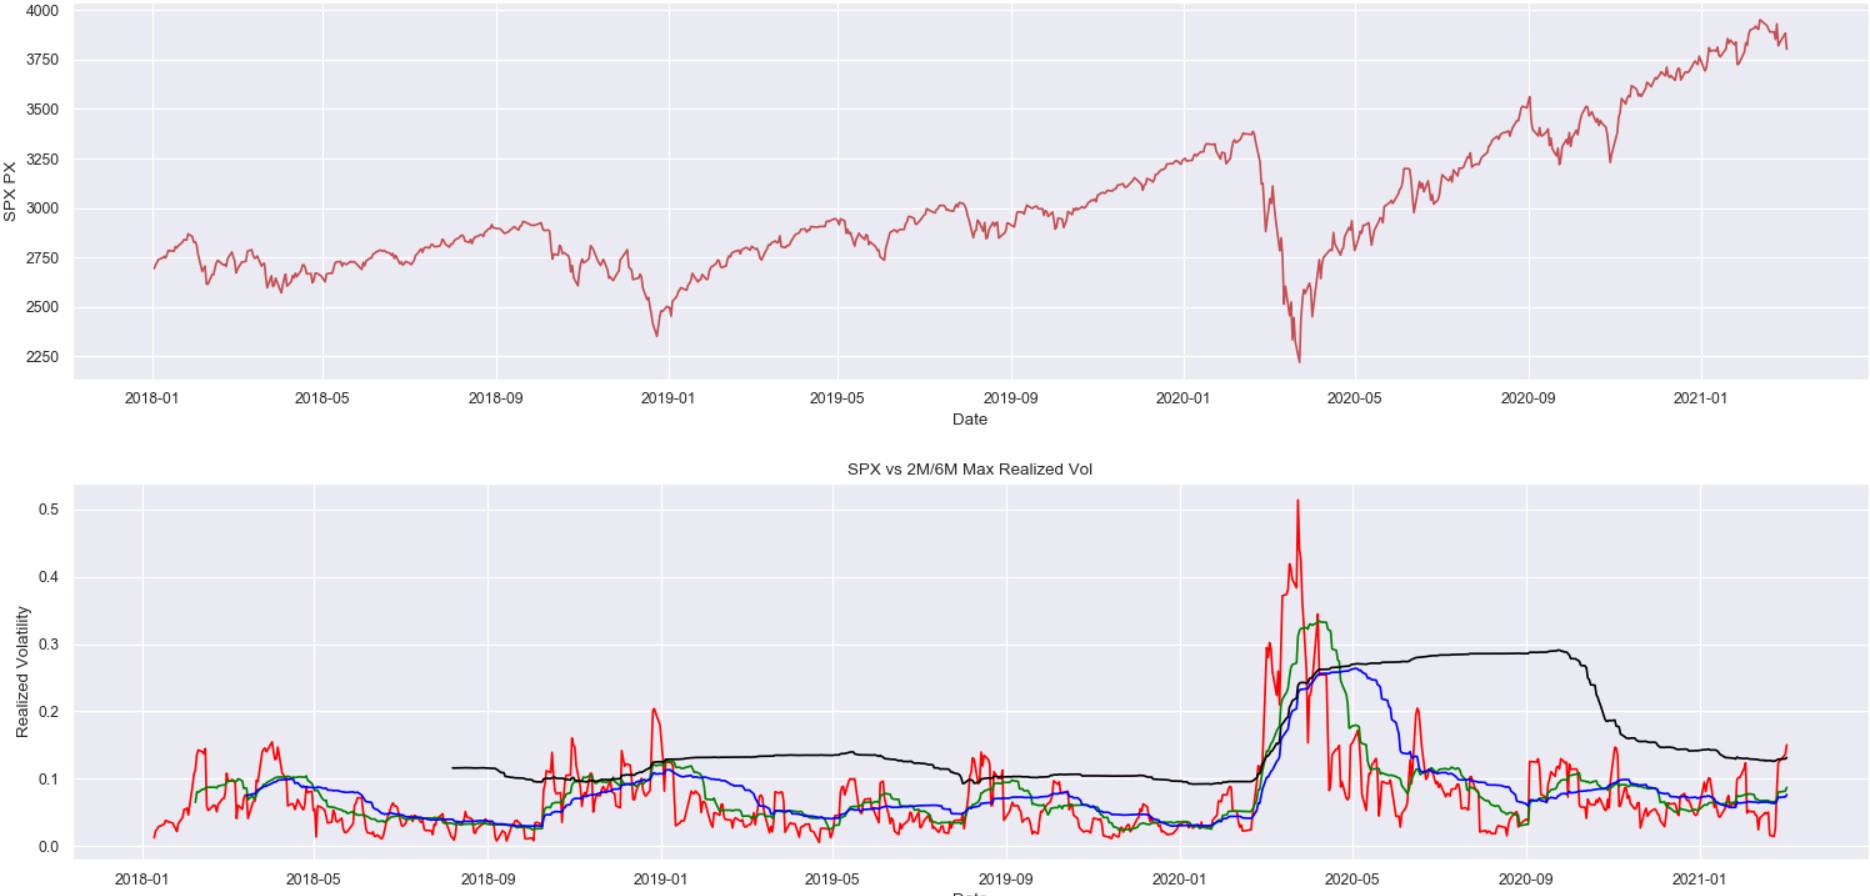
With this low put demand its apparent that realized volatility has broken out as you can see below. However our risk reversal metric reflects that put prices have not made a large move relative to calls.
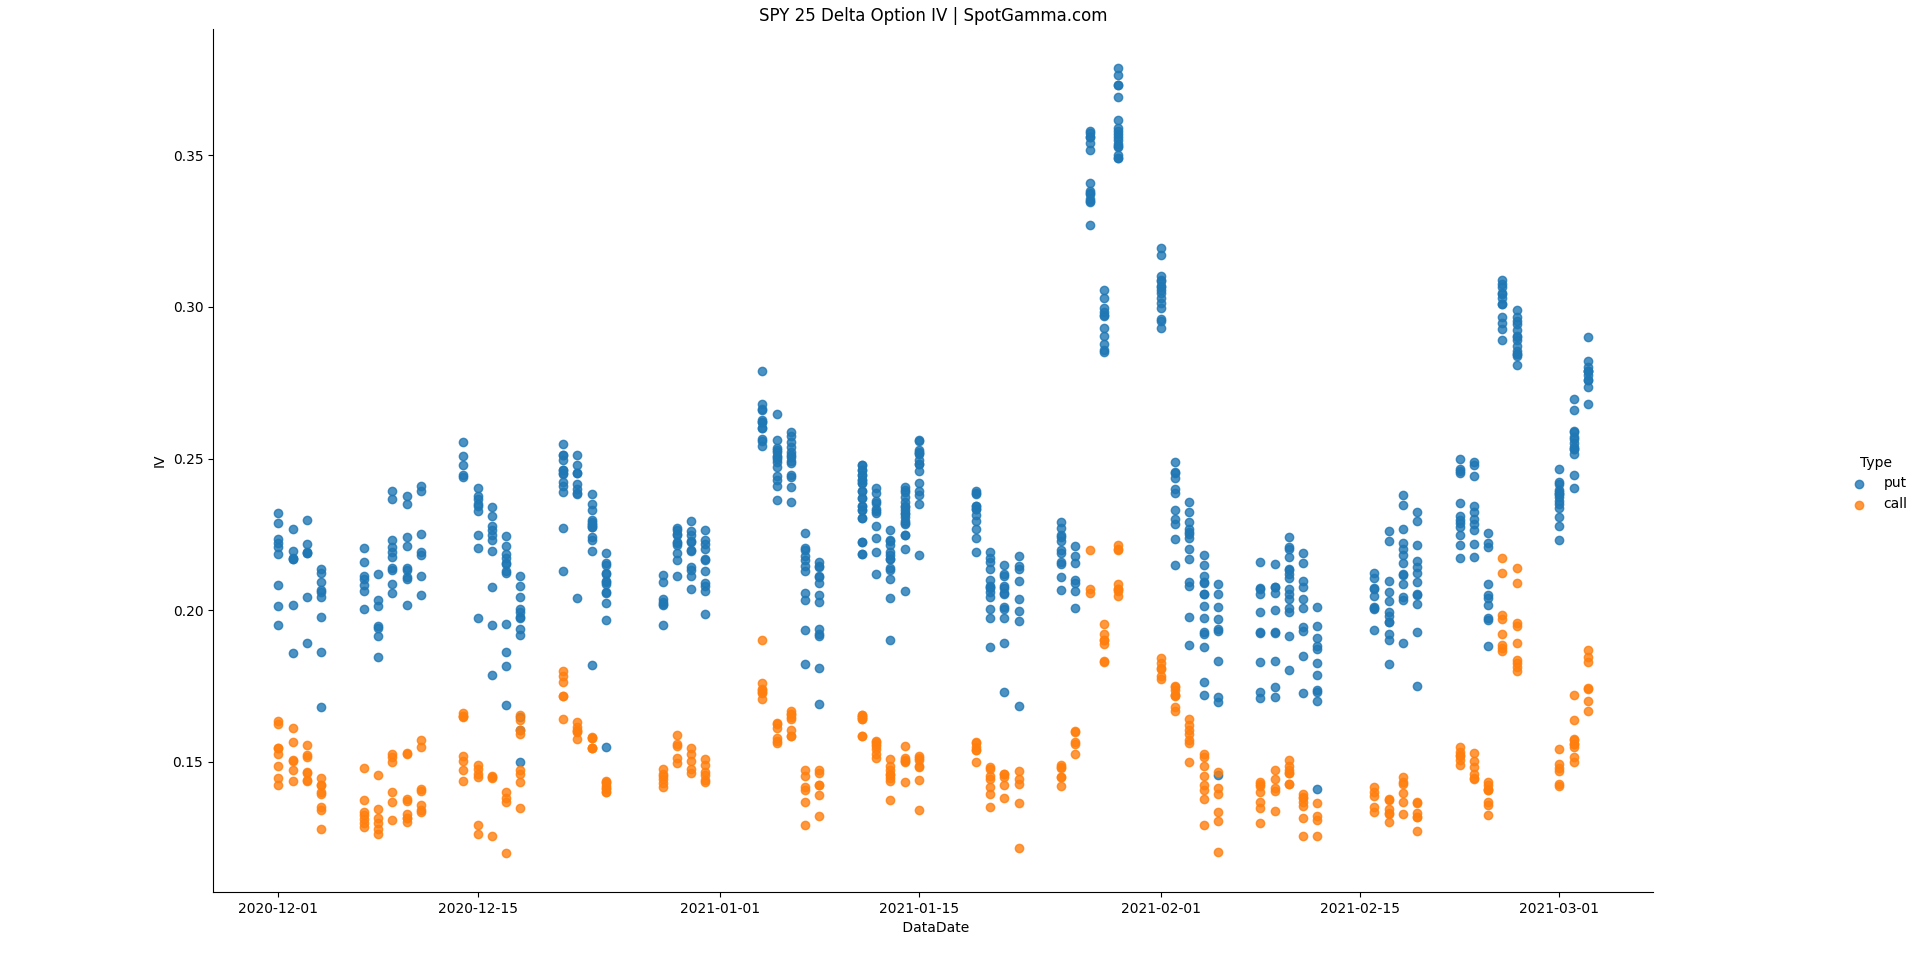
 SPY implied volatility has certainly picked up but still remains below that of late Januarys market spasm (each dot here represents an option with a different expiration). In other words we are realizing a higher volatility than at any point since June ’20, but downside protection is not being priced at a similar level.
Much of what happens in the markets today may be determined by what Fed Powell says at 12EST today. There is a lot shifting in the bond/credit markets and if that volatility continues it likely spills into equity markets.
Despite the negative skew to our views, the SPX has room for a quick move back to 3850 if markets are calmed by the Fed, and implied volatility (ie VIX) comes in. That being said, we maintain that a more stable bull run starts from >3900 and would be somewhat skeptical of any rally until/unless markets recapture that large gamma level.
Macro Note:
3800 support 4000 resistance into March OPEX
| Signal Name | Latest Data | Previous | SPY | NDX | QQQ | ||
|---|---|---|---|---|---|---|---|
| Ref Price: | 3802 | 3814 | 379 | 12612 | 309 | ||
| VIX Ref: | 26.67 | 26.67 | |||||
| SG Gamma Index™: | -0.23 | 0.14 | -0.06 | -0.02 | -0.17 | ||
| Gamma Notional(MM): | $-308 | $-379 | $-379 | $-3 | $-1,009 | ||
| SGI Imp. 1 Day Move: | 1.26%, | 48.0 pts | Range: 3754.0 | 3850.0 | ||||
| SGI Imp. 5 Day Move: | 3835 | 5.28% | Range: 3633.0 | 4038.0 | ||||
| Zero Gamma Level(ES Px): | 3850 | 3863 | — | 0 | |||
| Vol Trigger™(ES Px): | 3855 | 3860 | 384 | 13300 | 320 | ||
| SG Abs. Gamma Strike: | 3800 | 3900 | 385 | 12800 | 310 | ||
| Put Wall Support: | 3700 | 3700 | 375 | 12500 | 310 | ||
| Call Wall Strike: | 4000 | 4000 | 395 | 13700 | 335 | ||
| CP Gam Tilt: | 0.93 | 0.79 | 0.88 | 0.76 | 0.42 | ||
| Delta Neutral Px: | 3727 | ||||||
| Net Delta(MM): | $1,267,161 | $1,252,131 | $198,063 | $37,391 | $90,428 | ||
| 25D Risk Reversal | -0.1 | -0.1 | -0.11 | -0.11 | -0.11 | ||
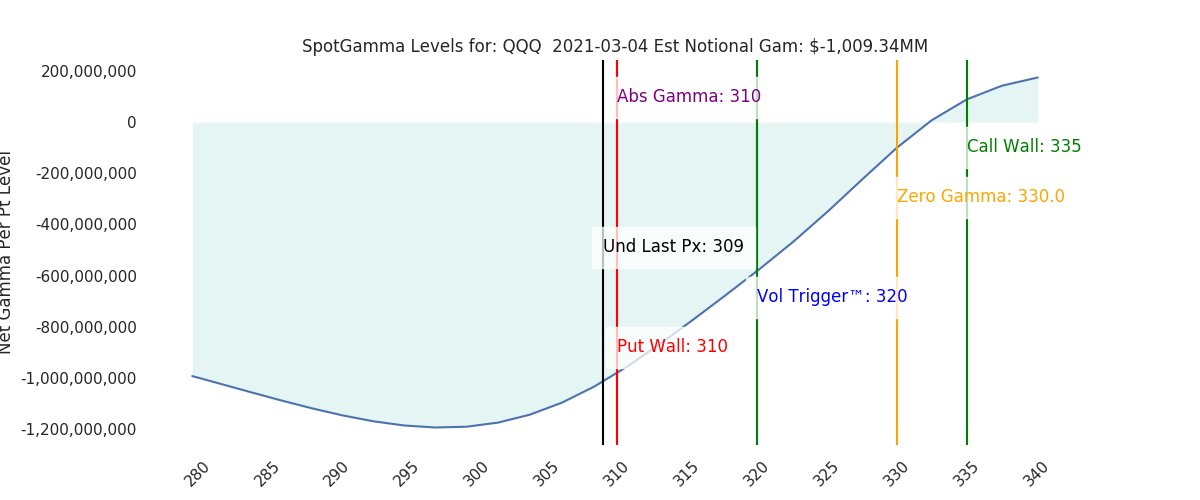
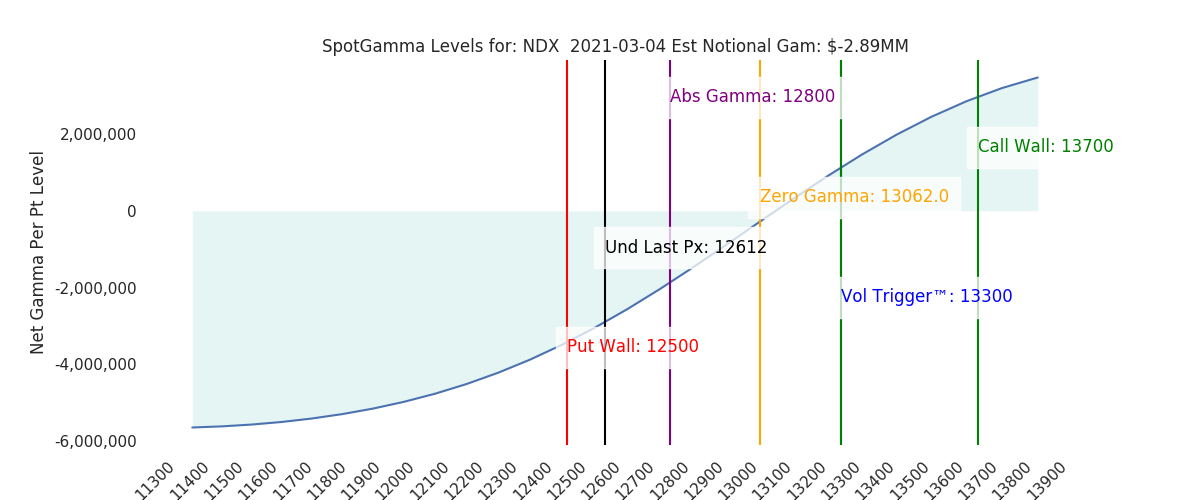
| Top Absolute Gamma Strikes: SPX: [3900, 3850, 3800, 3700] SPY: [395, 390, 385, 380] QQQ: [320, 315, 310, 300] NDX:[13000, 12800, 12500, 12000] SPX Combo: [3876.0, 3872.0, 3728.0, 3902.0, 3800.0] NDX Combo: [12619.0, 12418.0, 12292.0, 12821.0, 12330.0] The Volatility Trigger has moved DOWN: 3855 from: 3860 SPX is below the Volatility Trigger™. The 3850.0 level is first level of resistance and is critical as its the negative gamma threshold. The trigger level of: 3855 will act as overhead resistance. Watching VIX is key, if volatility comes in dealers will start to buy back shares as their short puts lose value. This could start a rally. The total gamma has moved has moved UP: $-308MM from: $-380.00MM Gamma is tilted towards Puts, may indicate puts are expensive Negative gamma is moderate favoring further swings in the market |
| Sub Login Follow @SpotGamma Strike Charts Historical Chart Gamma Expiration Tool |
| ©TenTen Capital LLC d.b.a. SpotGamma Please leave us a review: Click Here |
| See the FAQ for more information on reading the SpotGamma graph. |
| SpotGamma provides this information for research purposes only. It is not investment advice. SpotGamma is not qualified to provide investment advice, nor does it guarantee the accuracy of the information provided. This email is intended solely for subscribers, please do not distribute the information without the express written consent of SpotGamma.com. |
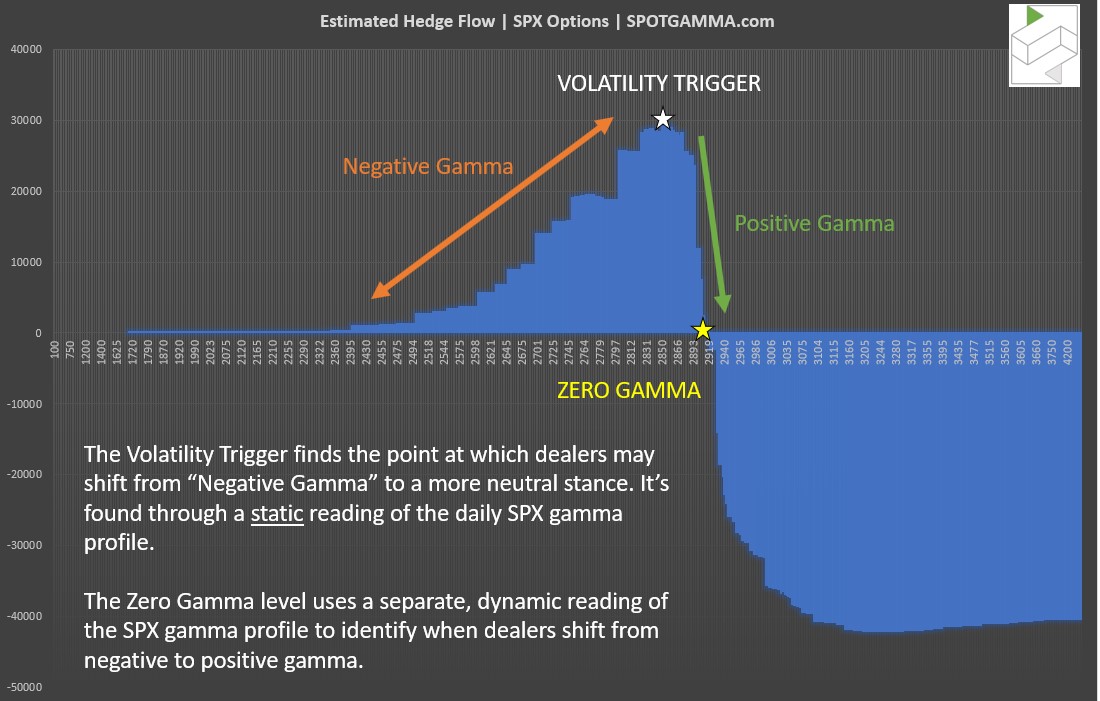
| SPX Ref: Estimated ES Futures price at which data was run. VIX Ref: Estimated VIX price at which data was run. SG Gamma Index: Proprietary gamma modeling index value. Combo Strike™: A combination of SPY/SPY open interest, then “price normalized” back to the SPX Gamma Notional: Estimated amount of notional gamma based on traditional gamma modeling. SG Imp. 1SD Move: For one day ahead it is the projected 1 standard deviation SPX move implied by the SG Gamma Index. High Gamma Strike: Strike with the highest level of net positive gamma. Seen as a resistance level. Top Absolute Gamma Strike: Level with most call gamma + put gamma. Zero Gamma Strike: Estimated level at which gamma flips from positive (above strike) to negative (below strike). Volatility Trigger™: Similar to Zero Gamma in that its a level at which dealers may shift from positive (above trigger) to negative (below strike). Click here for a Zero Gamma vs Volatility Trigger Diagram Put Wall Strike: Strike with largest level of put gamma. Seen as a general support area. CP Gamma tilt: Call gamma to put gamma ratio. Extreme readings may show skewed investor sentiment. Delta Neutral Strike: Estimate where the options market may price the delta neutral level. This is NOT model adjusted meaning that we make no assumption on dealer positioning. 25 D Risk Reversal: A measurement of the 25 delta call minus 25 delta put on a ~30 day rolling basis. Used to measure call values relative to puts. |