Happy New Year! Best Wishes for 2023.
Macro Theme: |
Key Levels: |
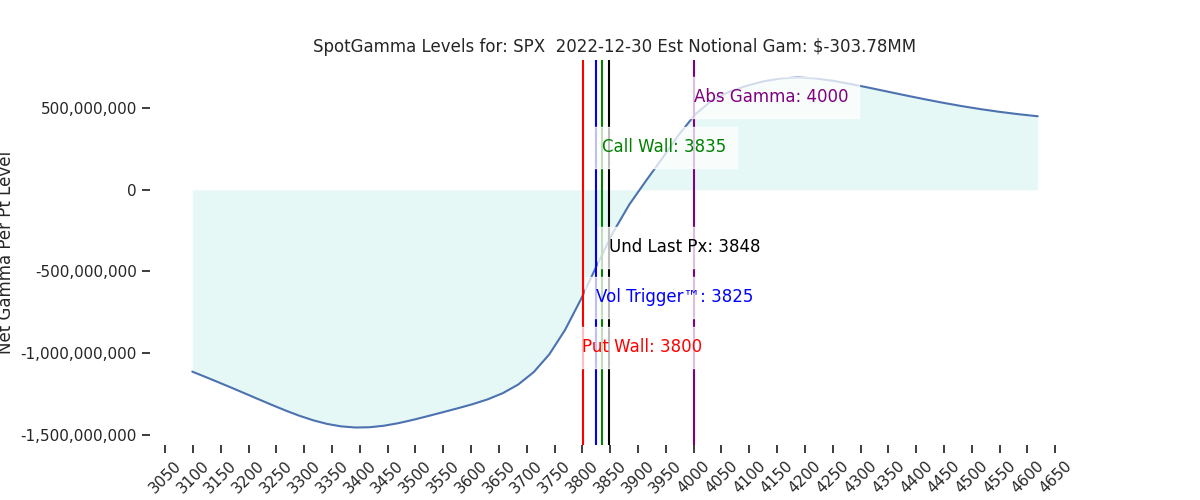
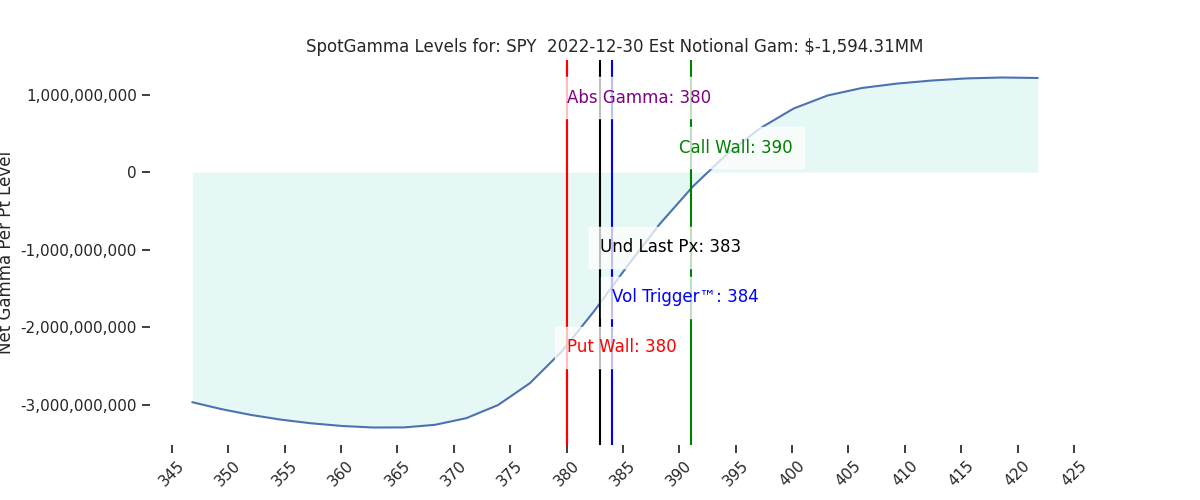
| >Major resistance: $3,900 (SPY Call Wall) >Major support: $3,765 (SPY Put Wall) >Critical Dates: 12/30 OPEX – Large JPM Collar Strike: $3,835 >Major risk lies on a break of 3765, as dealers may flip to negative gamma hedging | Ref Price: 3848 SG Implied 1-Day Move: 1.26% SG Implied 5-Day Move: 3.07% Volatility Trigger: 3825 Absolute Gamma Strike: 4000 Call Wall: 3835 Put Wall: 3800 |
Daily Note:
Futures have consolidated to 3850, which implies an SPX open near the JPM collar call strike of 3835. We see resistance today at 3850, 3868, then 3900. Support shows at 3800, then 3765 (SPY Put Wall).
As we detailed in yesterdays AM note, there are likely some large JPM Collar related flows, and possible some other large year end flows entering markets today. Further compounding this is holiday liquidity. For these reasons we believe the 3835 area pin is now effectively gone, and we look for a move away from that strike today. Again, we recommend reviewing yesterdays AM post for our thoughts on trade today.
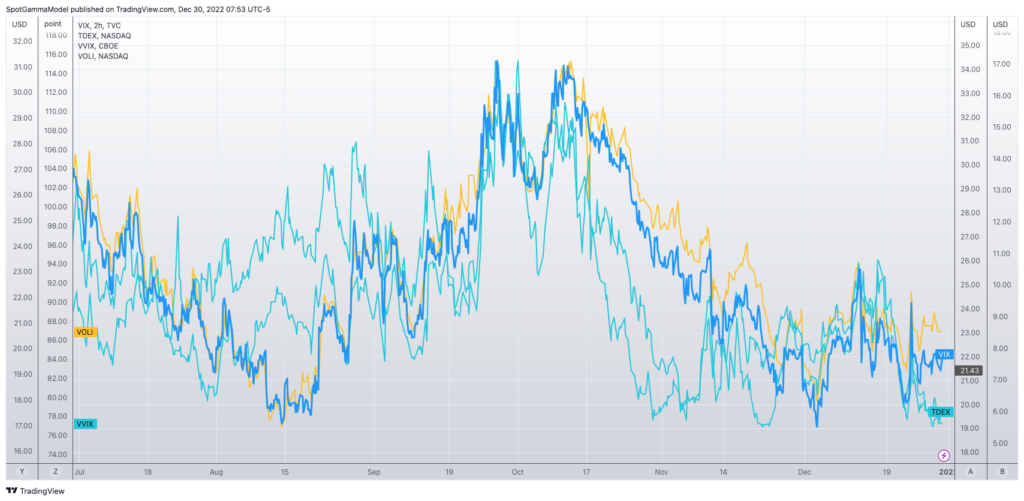
As we look past the noise of this session, January should start with quite a bit more movement. Even if there is some relative weakness today, it remains that there is little to not demand for downside protection. Nearly every IV metric available syncs with this idea, including the numerous metrics plotted below.
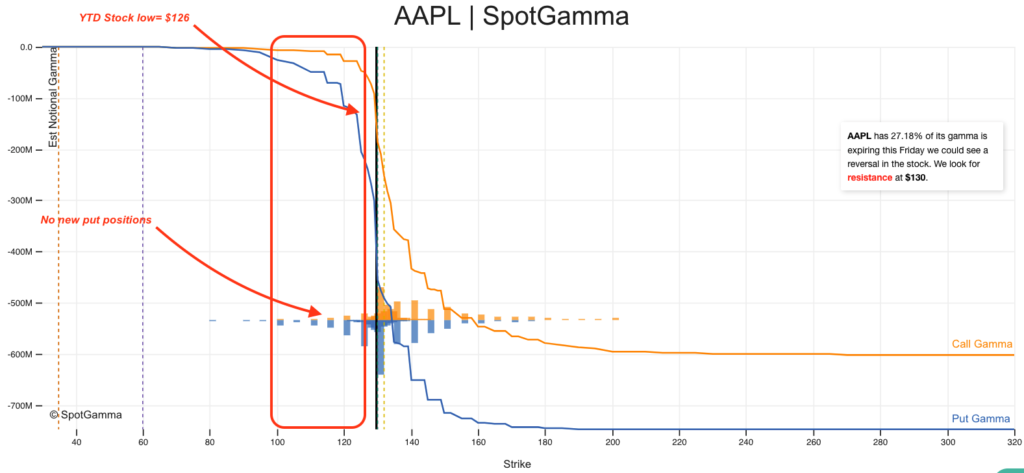
Further, as discussed in yesterdays Q&A, there doesn’t appear to me incremental put demand in names that are being sold off (ex: TSLA, AAPL, AMZN). Shown below is our EquityHub snapshot for AAPL, which hit YTD lows of $126 on Wednesday. Despite this weakness, there is very little put positioning at strikes under $126, which is indicated by the blue bars.
The point here is that options traders aren’t betting on more downside, which lines up with the “sleepy” IV metrics posted above.
The data above adds to our view that January may see a rather strong equity rally, in line with what we have discussed recently (here & here). Trade the first week of January should help shed light on the timing of the rally (i.e. pre-OPEX or post-OPEX).
It’s certainly a possibility that January opens the floodgates to rampant downside put demand, and the VIX spikes to 50. However, we would need some type of major catalyst to spark that move, which would not only drive new put purchases, but also short put covering. However, despite all that has happened in the last year, that type of move never happened. As an example consider the 2022 intraday VIX high was back on January 24th, the day after that huge, call-heavy OPEX.
| SpotGamma Proprietary SPX Levels | Latest Data | SPX Previous | SPY | NDX | QQQ |
|---|---|---|---|---|---|
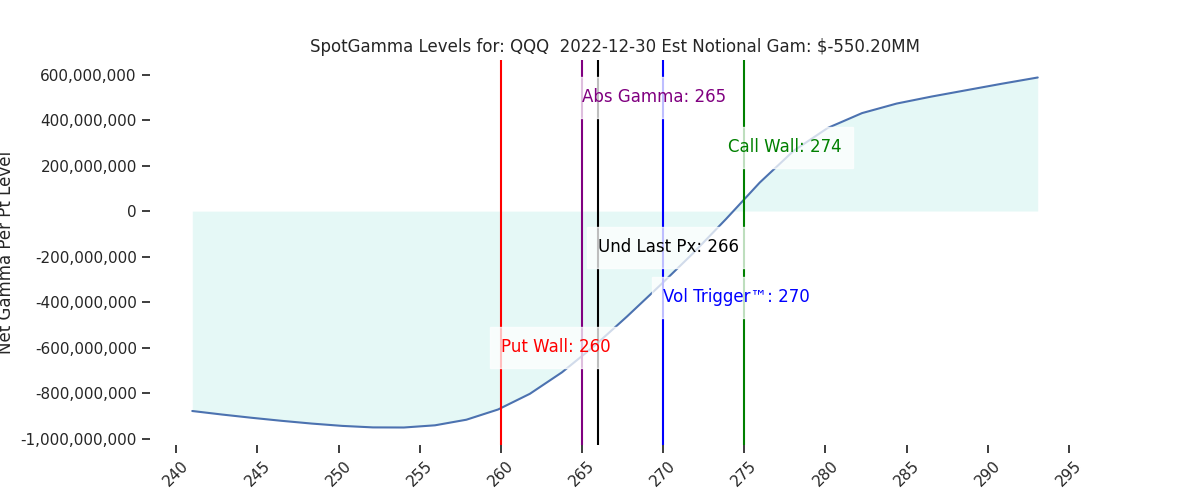
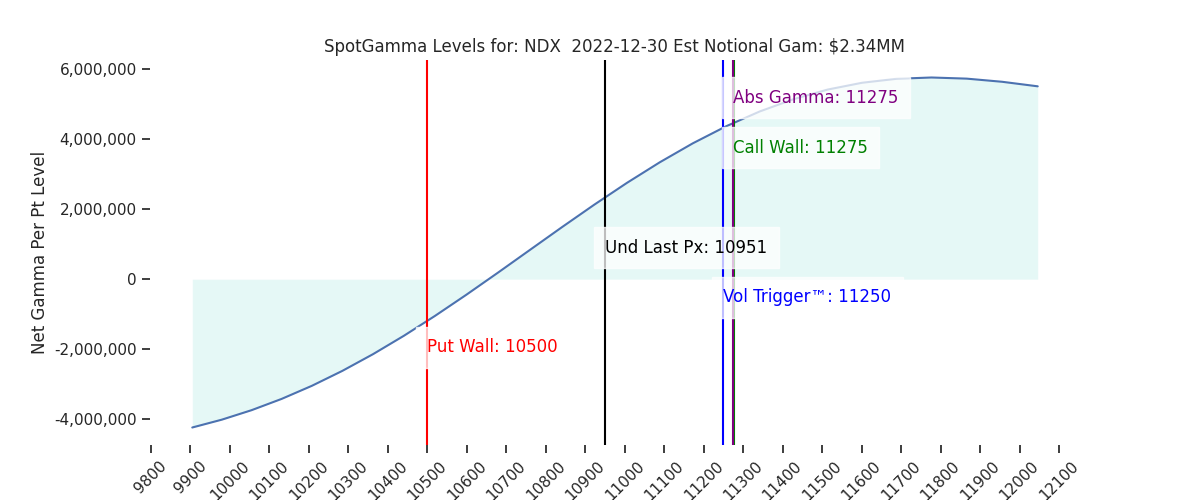
| Ref Price: | 3848 | 3851 | 383 | 10951 | 266 |
| SG Implied 1-Day Move:: | 1.26%, | (±pts): 48.0 | VIX 1 Day Impl. Move:1.35% | ||
| SG Implied 5-Day Move: | 3.07% | 3844 (Monday Ref Price) | Range: 3726.0 | 3962.0 | ||
| SpotGamma Gamma Index™: | -0.11 | -1.26 | -0.27 | 0.02 | -0.08 |
| Volatility Trigger™: | 3825 | 3825 | 384 | 11250 | 270 |
| SpotGamma Absolute Gamma Strike: | 4000 | 4000 | 380 | 11275 | 265 |
| Gamma Notional(MM): | -304.0 | -157.0 | -1594.0 | 2.0 | -550.0 |
| Put Wall: | 3800 | 3700 | 380 | 10500 | 260 |
| Call Wall : | 3835 | 3835 | 390 | 11275 | 274 |
| Additional Key Levels | Latest Data | Previous | SPY | NDX | QQQ |
|---|---|---|---|---|---|
| Zero Gamma Level: | 3909 | 3883 | 391.0 | 10624.0 | 299 |
| CP Gam Tilt: | 0.97 | 0.92 | 0.61 | 1.25 | 0.68 |
| Delta Neutral Px: | 3933 | ||||
| Net Delta(MM): | $1,415,747 | $1,436,175 | $152,015 | $38,864 | $79,630 |
| 25D Risk Reversal | -0.04 | -0.04 | -0.03 | -0.05 | -0.04 |
| Call Volume | 468,971 | 495,883 | 1,696,902 | 6,163 | 747,028 |
| Put Volume | 673,884 | 771,364 | 2,382,333 | 5,483 | 1,291,958 |
| Call Open Interest | 5,528,161 | 5,609,516 | 6,941,156 | 57,163 | 5,041,764 |
| Put Open Interest | 10,027,726 | 9,774,163 | 12,493,086 | 51,470 | 5,991,004 |
| Key Support & Resistance Strikes: |
|---|
| SPX: [4000, 3900, 3850, 3835] |
| SPY: [385, 382, 380, 375] |
| QQQ: [280, 270, 265, 260] |
| NDX:[12000, 11500, 11275, 11000] |
| SPX Combo (strike, %ile): [(3999.0, 82.48), (3926.0, 78.85), (3876.0, 74.53), (3868.0, 84.33), (3833.0, 99.53), (3826.0, 80.29), (3814.0, 92.82), (3799.0, 96.18), (3776.0, 85.83), (3764.0, 86.45), (3749.0, 93.54), (3714.0, 75.87), (3699.0, 94.89)] |
| SPY Combo: [381.91, 378.46, 368.49, 373.47, 379.99] |
| NDX Combo: [11280.0, 10688.0, 10896.0, 10852.0, 10480.0] |
| ©TenTen Capital LLC d.b.a. SpotGamma Please leave us a review: Click Here |
| See the FAQ for more information on reading the SpotGamma graph. |
| SpotGamma provides this information for research purposes only. It is not investment advice. SpotGamma is not qualified to provide investment advice, nor does it guarantee the accuracy of the information provided. This email is intended solely for subscribers, please do not distribute the information without the express written consent of SpotGamma.com. |