• Skip to main content
  • Skip to primary sidebar

SpotGamma™

S&P 500 Stock Market Gamma Trading Levels Based on Options Open Interest

  • About
  • Pricing
  • Academy
  • Resources
    • Tool Demos
    • Case Studies
    • Blog
    • Support Center
    • Free Daily Report
    • Free Trading Tools
      • Options Profit Calculator
      • SPX Gamma Exposure
      • Implied Earnings Moves
      • Volatility Ranking
    • Free Training
    • Report Card
  • Login

Jan 27 2023

SPX vs SpotGamma Call Wall, Put Wall

Listed here are some helpful statistics around two of SpotGamma’s key proprietary support and resistance levels:

The SPX Call Wall & Put Wall

These levels are derived purely from options positioning.

This data is based off of 1265 trading days, ending 1/20/2023.

SPX Call Wall

  • How many times did the market open within 1 % of the Call Wall: 36%
  • On an open within 1% of the Call Wall, how often was the Call Wall breached? 28%
  • How many times did the SPX open above the Call Wall: 8%
  • If the SPX opened above the Call Wall, how often did it hold above the wall? 17%
  • When the Call Wall was breached, how often did it close above: 32%
  • If the SPX closes above the Call Wall, what is the average close above the Wall: 0.67%
  • 1 Day Forward Return after close above Call Wall: -0.24%
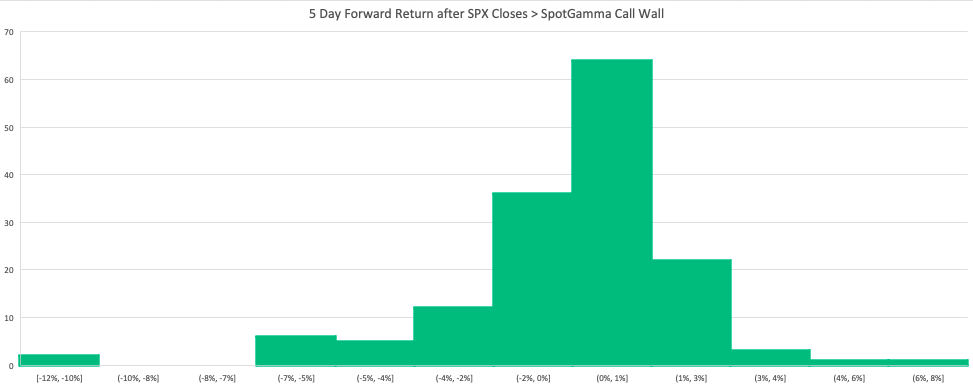
  • 5 Day Forward Return after close above Call Wall: -0.38%

As you can see here, the SPX tends to have negative 1 day, and 5 day (second plot) forward price performance the day after closing above the Call Wall resistance level.
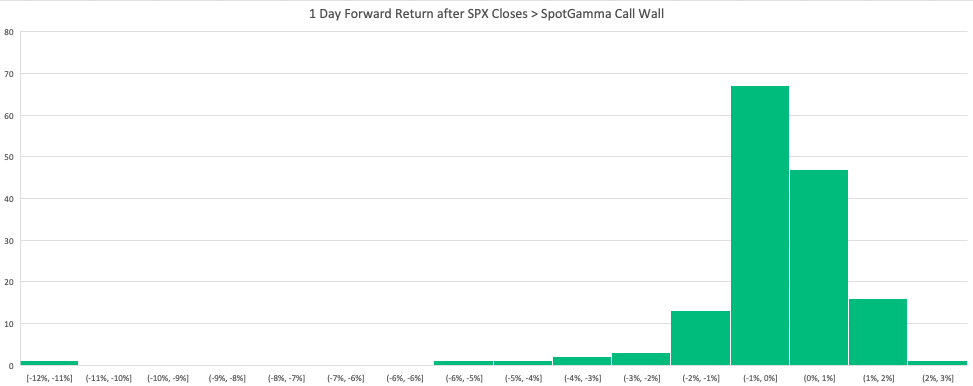
1 day forward return after SPX closes above the Call Wall

5 day forward return after SPX closes above the Call Wall

SPX Put Wall

  • How often did the market open within 1 % of the Put Wall: 12%
  • On an open within 1% of the Put Wall, how often was the Put Wall breached? 34%
  • How often did the SPX open below the Put Wall: 4%
  • If the SPX opened below the Put Wall, how often did it hold below the wall? 21%
  • When the Put Wall was breached, how often did it close below: 39%
  • If the SPX closes below the Put Wall, what is the average close below the Wall: -1.6%
  • 1 Day Forward Return after close below Put Wall: -1.45%
  • 5 Day Forward Return after close below Put Wall: 0.26%

The S&P tends to have negative forward 1 day price performance after closing below the Put Wall.
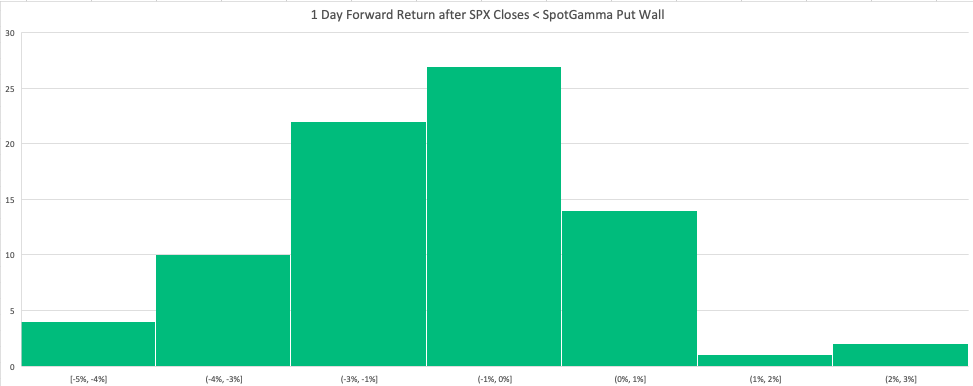
1 day forward return after SPX closes below the Put Wall

Contrary to 1 day performance, the S&P tends to have positive 5 day forward performance after closing below the Put Wall.
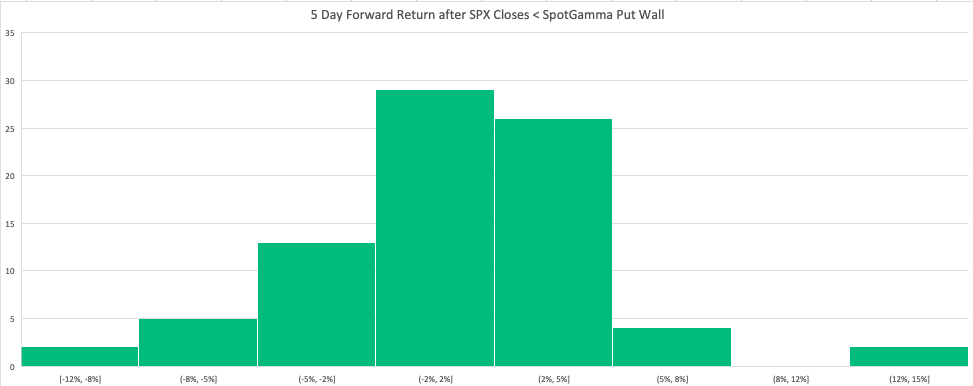
5 day forward return after SPX closes below the Put Wall

Share This Article

  • Share
  • Twitter
  • LinkedIn
  • Reddit
  • Facebook

Written by SpotGamma · Categorized: Staging · Tagged: Wall Stats

Don’t have an account with SpotGamma?

Choose the plan you want today to view unique support and resistance levels, access Founder’s Notes and expert commentary, daily trading ranges, and entrance into our private Discord.


Primary Sidebar

SpotGamma-Subscriber-Signup-Banner

  • Volatility Has Compressed. What Happens Next?
  • Another SpaceX Unlock, and Why $150 Still Caps the Stock
  • Options Exchange Monitor — Week of August 15, 2026 (36 SEC notices, 2 CFTC, 0 EDGAR)
  • GEX Levels for SPY, QQQ, ES and NQ: Using Index Gamma in Any Product
  • How to Trade GEX Levels: A Practical Guide to Gamma-Based Trading
  • youtube
  • x
  • Privacy Policy
  • Disclaimer
  • Terms & Conditions
  • Support Center
  • Media
  • Contact Us

©2026 TenTen Capital LLC DBA SpotGamma

All SpotGamma materials, information, and presentations are for educational purposes only and should not be considered specific investment advice nor recommendations. Futures, foreign currency and options trading contains substantial risk and is not for every investor. An investor could potentially lose all or more than the initial investment. Risk capital is money that can be lost without jeopardizing one's financial security or lifestyle. Only risk capital should be used for trading and only those with sufficient risk capital should consider trading. Past performance is not necessarily indicative of future results. Testimonials appearing on this website may not be representative of other clients or customers and is not a guarantee of future performance or success.

View Full Risk Disclosure