The following is a guest post from Doug Pless.
Preparation
When I plan to trade futures, I begin my morning preparation by reading the SpotGamma AM Founder’s Note. For ES futures, I note key Gamma levels for SPX and SPY, the SpotGamma Imp. 1 Day Move for SPX, the SpotGamma Gamma Index and Gamma Notional for SPX and SPY, and resistance and support levels for SPX and SPY. Please see the SpotGamma Glossary for descriptions of these levels and terms.
I also look up SPX and SPY in Equity Hub. First, I review the data and note the Key Gamma Strike for each instrument. The Key Gamma Strike is a strike where volatility may increase or decrease. This level can act as a pivot or pin area.
I also review the Composite View and Put & Call Impact charts in Equity Hub. The Composite View chart shows how fast Gamma changes at different price levels. The rate of change of Gamma is shown by the SG Momentum Indicator, plotted on the y-axis. A high SG Momentum Indicator indicates Gamma changes more rapidly at that price level. It also indicates higher expected volatility. The Put & Call Impact chart shows the amount of put and call Gamma at different price levels. This chart provides a clear visual representation of the put vs. call domination at different price levels. The steepness of the lines also shows the rate of change of Gamma. The steeper or more vertical a line, the higher the rate of change of Gamma at that level. Please see the Equity Hub Definitions & Terms for more information.
Then I look at the Vanna Models for SPX and SPY. These graphs show how Market Maker Delta exposure may shift as price and implied volatility (IV) move up or down. The slope of the lines indicates how aggressively Market Makers may have to buy or sell ES futures to hedge their Delta exposure as price and IV change.
Finally, I watch the HIRO Indicator in the first minutes of trade after the RTH open. The HIRO Indicator shows the Market Maker hedging impact of options trades. Market Maker hedging flow can have a significant impact on order flow in ES and is often a good confirmation of price direction.
Based on this information, I develop a thesis regarding anticipated volatility, trading range, and directional bias for the day. An example of how I used this information to plan and execute a trade in ES futures is shown below.
Trade Analysis: September 19, 2022 (Post-Expiration Monday)
On September 19, the following metrics for SPX and SPY were shown in the AM Founder’s Note:
| SPX | SPY | |
| Volatility Trigger | 4000 (+) | 400 (-) |
| Zero Gamma | 4044 (+) | 405 (-) |
| Put Wall | 3800 (-) | 390 (-) |
| Call Wall | 4005 (+) | 430 |
| Key Gamma Strike | 4000 | 390 |
| SpotGamma Imp. 1 Day Move | 1.16% | N/A |
| SpotGamma Gamma Index | -1.33 | -0.41 |
| Gamma Notional | -742 MM | -2047 MM |
| Support | 3800 | N/A |
| Resistance | 3900, 3950 | N/A |
Note: A plus sign (+) after a number indicates the value increased from the previous day. A minus sign (-) after a number indicates the value decreased from the previous day.
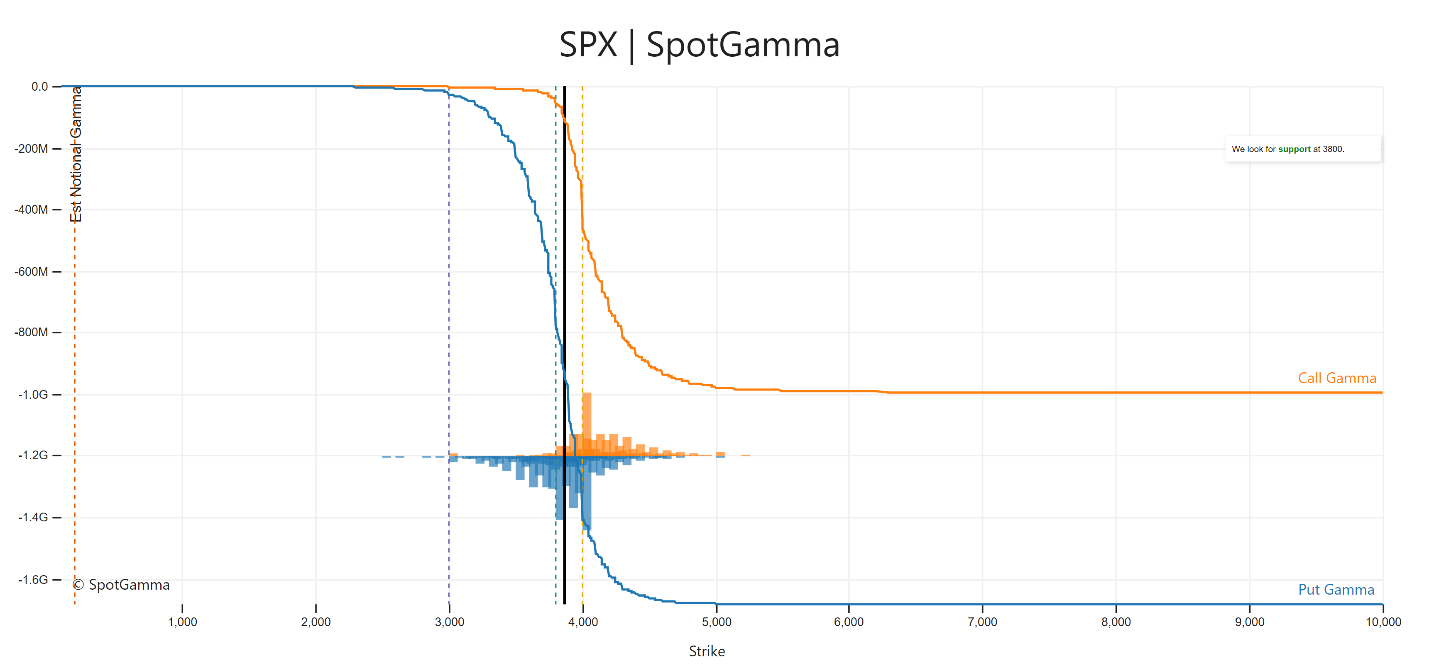
The Put & Call Impact charts for SPX and SPY from Equity Hub showed significantly more put Gamma than call Gamma. This indicates that puts were driving the price action for each instrument. The SPX chart showed that Gamma would change quickly between around 3500 – 4000, and that 4000 was the dominant strike for calls and puts.
The SPY chart showed that Gamma would change rapidly between about 350 – 400 and that 390 was the dominant strike for puts. The key takeaway from these charts is the clear dominance of put Gamma for both instruments.
The SPX and SPY from Put & Call Impact charts from Equity Hub are shown below.

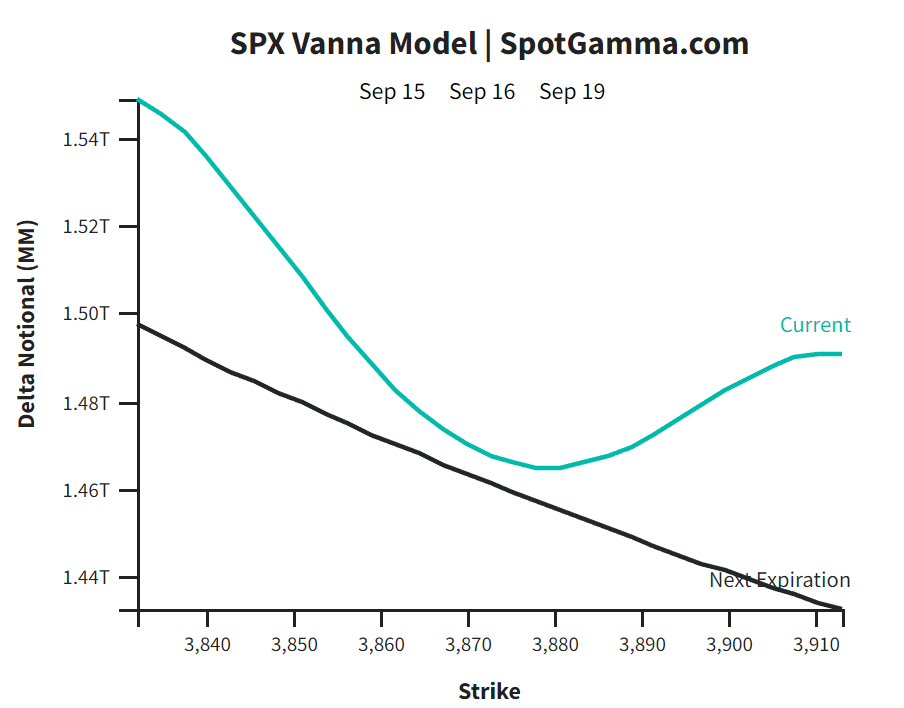
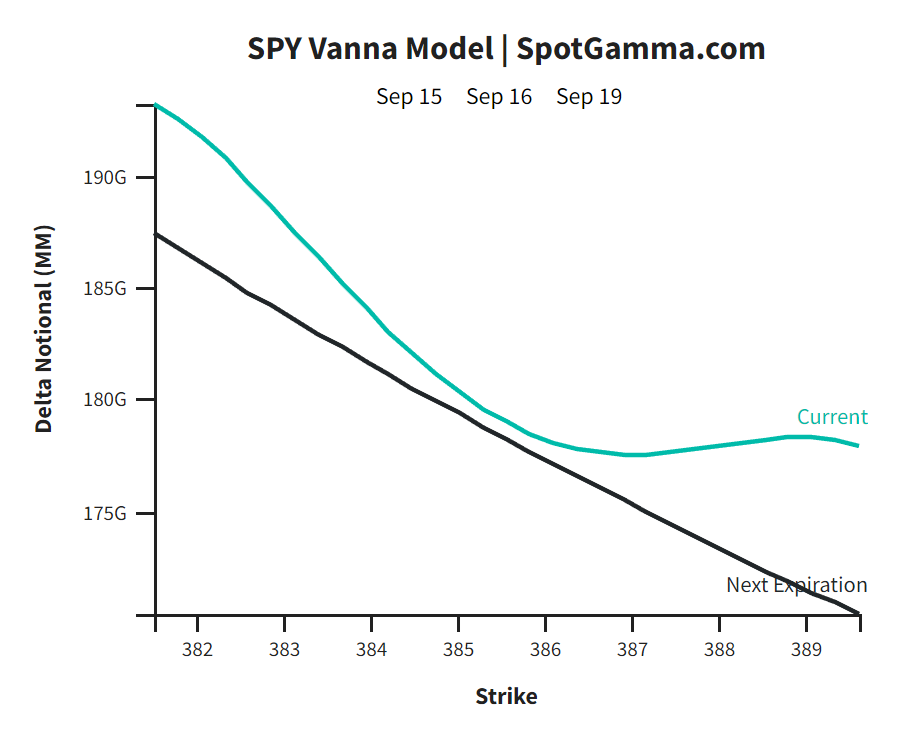
The SPX and SPY Vanna Models for September 19 showed significant skew with Delta Notional increasing as SPX/SPY falls and decreasing as SPX/SPY rises. This indicates Market Makers would need to sell ES futures to hedge their Delta exposure as SPX/SPY price moves down and buy ES futures as SPX/SPY moves up.
The SPX and SPY Vanna Models are shown below.
Finally, the AM Founder’s Note highlighted the “put-weighted opex rally dynamic.” In a market dominated by puts, when SPX and SPY puts expire on Friday, Market Makers can buy back short ES hedges on Monday, sparking a rally. The note included a couple of prescient quotes:
- “Unsurprisingly OPEX brought the closing and rolling of ITM to OTM puts which has resulted in the SPX Put Wall shift to 3800, and a buildup of puts at SPY 380. We anticipate traders looking to sell ultra-short dated “pre-Fed” puts today which could help add market support.”
- “After large put expirations, like Friday, we often see markets make lows the Monday after expiration (i.e. today).”
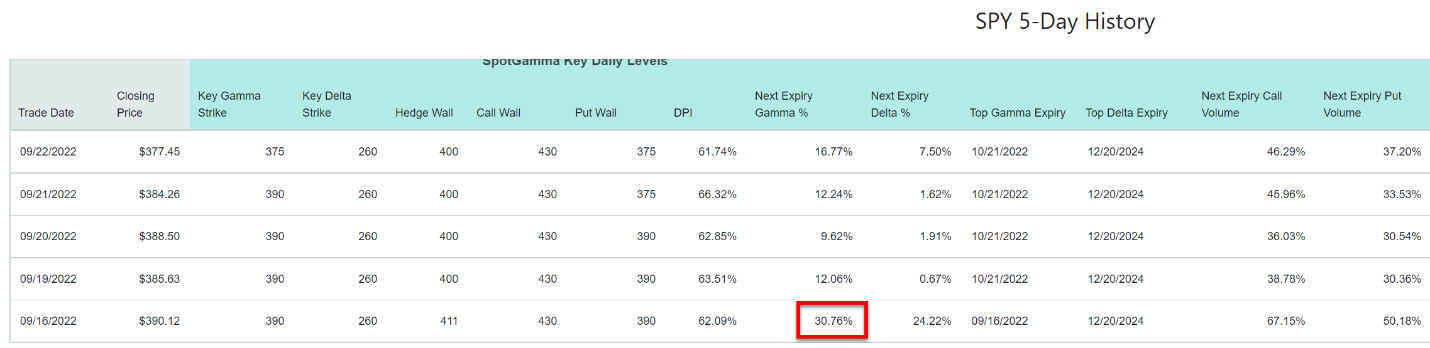
The SPY 5-Day History in Equity Hub confirmed that almost 31% of Gamma expired on Friday, 9/16. The SPY 5-Day History, taken on 9/22, is shown below.
Based on the 1.16% SPX SpotGamma Imp. 1 Day Move, negative SpotGamma Gamma Index for SPX/SPY, negative Gamma Notional for SPX/SPY, and the skewed SPX/SPY Vanna Models, I was looking for a high volatility day with a wide trading range. Market makers would likely be trading with the directional movement of the market rather than against it.
Based on the notes in the AM Founder’s Note and the amount of SPY Gamma that expired on the previous day, my bias was bullish. I expected large moves and planned to look for opportunities to enter long trades in the direction of the movement.
As expected, traders began aggressively selling SPY puts at the RTH open. This activity is shown by the blue line in the SpotGamma HIRO chart shown below.

The upward-sloping HIRO Indicator (green line in the sub-chart) in the Bookmap chart below confirmed that Market Maker hedging flow was bullish. The indicator showed that Market Makers were buying ES futures to hedge bullish option trades, primarily in SPY.

The Bookmap chart shows that ES moved sharply higher from RTH open. The first opportunity for a long entry was around 9:40 am ET, shown by the first #4 note in the chart. ES stalled at the Combo L3 level (SPX 3849) for a few minutes, retested the level, and then continued to rally. There were several additional opportunities to enter long positions, shown by #4 notes, as ES moved up to the primary target for the morning session at ES 3900.
The Bookmap ES and SPY charts below show how the day played out. ES/SPY rallied sharply from the RTH open to ES 3900 / SPY 387. ES/SPY then dropped down to SPY 384 and traded in a range between SPY 384 and 386 for several hours, as Market Maker hedging flow remained bullish to neutral. Around 2 PM ET, thousands of buy Iceberg orders in ES (cyan line in ES sub-chart) sparked a rally to the SPX L3 3900 Resistance level at the RTH close.


Resources
For further definitions and information on the terms used in this article, please see the SpotGamma Support Center for a list of dozens of SpotGamma proprietary terms, as well as context for common market terminology.
SpotGamma Products Used:
- SpotGamma Alpha
- AM Founder’s Note (available in all SpotGamma subscription levels)
- Equity Hub (available in SpotGamma Pro and Alpha)
- HIRO Indicator (available on Bookmap, as well as inside SpotGamma Alpha)