A ZEBRA (Zero Extrinsic Back RAtio) is an options strategy that replicates owning roughly 100 shares of stock using a fraction of the capital, with defined risk. You buy two in-the-money options and sell one at-the-money option, structured so the extrinsic value you sell cancels the extrinsic value you buy — hence “zero extrinsic.” The result behaves like a stock position: roughly 100 delta, no time-decay bleed, and a maximum loss limited to the debit paid.
Key Takeaways
- A call ZEBRA (bullish) buys 2 ITM calls (~70 delta each) and sells 1 ATM call (~50 delta), netting ~90–100 positive delta.
- A put ZEBRA (bearish) buys 2 ITM puts and sells 1 ATM put, netting ~90–100 negative delta.
- Because sold extrinsic offsets bought extrinsic, theta decay is near zero at entry — unlike a plain long call or put.
- Max loss is the net debit — far less than the loss potential of holding (or shorting) the shares.
- Strike selection and timing improve when anchored to the options positioning levels that drive dealer hedging flows.
How the ZEBRA Works
Every option price has two parts: intrinsic value (how far in-the-money it is) and extrinsic value (time premium). The problem with simply buying a call to express a bullish view is that you pay extrinsic value, and that premium decays every day and collapses when implied volatility falls.
The ZEBRA solves this with a 2:1 back ratio. The at-the-money option you sell is nearly all extrinsic value. The two in-the-money options you buy carry a smaller amount of extrinsic each. Structured correctly, the extrinsic you collect from the short leg pays for the extrinsic in the long legs — leaving you holding mostly pure intrinsic exposure.
Call ZEBRA Example
Suppose a stock trades at $100:
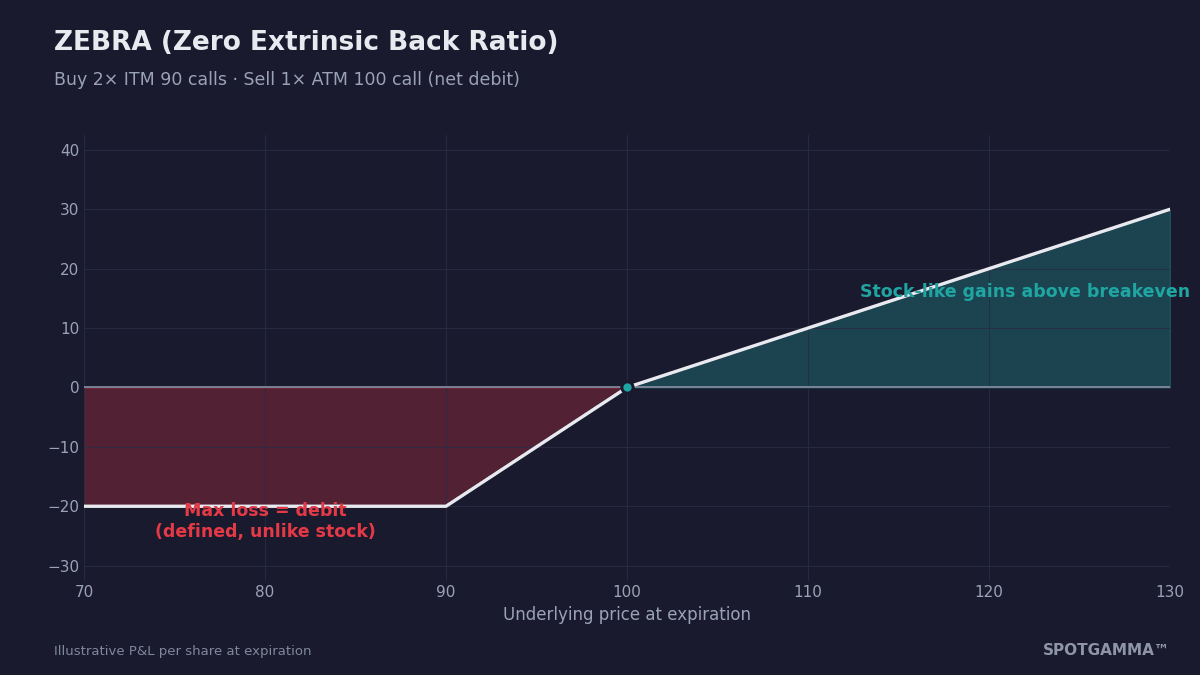
- Buy 2× the $90 calls (roughly 70 delta each) for $11.00 apiece — about $1.00 of that is extrinsic.
- Sell 1× the $100 call (roughly 50 delta) for $2.00 — nearly all extrinsic.
- Net debit: $20.00 ($2,000). Net delta: about +90. Net extrinsic: about zero.
From here the position gains and loses almost dollar-for-dollar with 100 shares of stock, but your worst case is the $2,000 paid rather than the $10,000 of downside stock owners carry to zero. Breakeven at expiration sits near the current stock price — not above it, as with a plain long call.
Put ZEBRA Example
The bearish version mirrors it: buy 2 ITM puts (for the $100 stock, the $110 puts near 70 delta) and sell 1 ATM put. You net roughly −90 delta with defined risk — short-stock-like exposure without the unlimited risk, borrow costs, or short-squeeze exposure of actually shorting shares.
ZEBRA vs. Buying Stock or Plain Calls
- Vs. stock: similar directional exposure for ~20% of the capital, with a hard floor on losses. The tradeoff: ZEBRAs expire; stock doesn’t.
- Vs. a long call: a plain call bleeds theta daily and suffers when implied volatility is crushed after events. The ZEBRA’s near-zero extrinsic profile largely sidesteps both.
- Vs. a married put / protective put: economically similar risk shape, but the ZEBRA needs no stock position and ties up less capital.
Using Positioning Data to Place and Time a ZEBRA
Because a ZEBRA is close to a pure delta position, entry level and timing matter more than volatility forecasting. This is where options positioning data gives you an edge over picking strikes blind:
- Enter near support/resistance defined by dealer positioning. A call ZEBRA initiated as the market tests a major Put Wall aligns your entry with the strike where dealer hedging tends to stabilize price. The Call Wall serves the same role as a profit target, or as the entry zone for a put ZEBRA.
- Check the gamma regime. In positive gamma exposure (GEX) regimes, moves tend to be contained — favoring entries at range extremes. In negative gamma regimes, moves extend — favoring momentum-style entries confirmed by real-time hedging flows in HIRO.
- Model it before you trade it. SpotGamma’s free Options Calculator lets you build the 2:1 structure, verify the net extrinsic is actually near zero at your chosen strikes, and stress the P&L across price and time.
Risks and Practical Notes
- The “zero extrinsic” balance only holds at entry. If the stock falls toward your long strikes (call ZEBRA), the position picks up extrinsic sensitivity and theta is no longer zero.
- Three legs means three bid/ask spreads. Use limit orders on the package, and prefer liquid underlyings with tight options markets.
- The short ATM leg can be assigned early around dividends — American-style single-stock options require attention near ex-dates.
- Defined risk is not small risk: the full debit is lost if the stock finishes below the long strikes (call version) at expiration.
FAQ
What does ZEBRA stand for in options trading?
Zero Extrinsic Back RAtio — a 2:1 ratio position (two long ITM options against one short ATM option) built so the net extrinsic value is approximately zero.
Is a ZEBRA bullish or bearish?
Either. A call ZEBRA is bullish (~+90 delta); a put ZEBRA is bearish (~−90 delta). Both are stock-replacement structures with defined risk.
What delta should the long options be?
The standard construction uses roughly 70-delta long options against a 50-delta short, which nets extrinsic value near zero. Verify the actual extrinsic math at current prices rather than relying on delta rules of thumb.
Does IV crush hurt a ZEBRA?
Far less than a plain long option. With near-zero net extrinsic value, there is little time premium for falling implied volatility to destroy — one of the structure’s main advantages for holding through events.
How is a ZEBRA different from a regular ratio backspread?
A standard backspread sells the ITM/ATM option and buys two further OTM options, often for a credit, profiting from large moves. The ZEBRA inverts this — long the ITM options — to mimic stock rather than bet on a volatility explosion.
This article is for educational purposes only and is not financial advice. Options involve substantial risk and are not suitable for all investors.