The following is a guest post courtesy of Michael Kramer of Mott Capital Management.
The equity markets have had sharp drawdowns and extremely high volatility in 2022.
While this dynamic has created a difficult backdrop for traders, the options market is playing a big role during these tricky times and SpotGamma indicators may provide an edge.
The NASDAQ 100 QQQ ETF has become one of the most widely followed ETFs. It started trading in 1999 and has more than $150 billion in total assets. It makes tracking the NASDAQ 100 index easy and has become a tool for many investors and institutions to trade the index. Additionally, the options products are used to initiate new positions or hedge current positions.
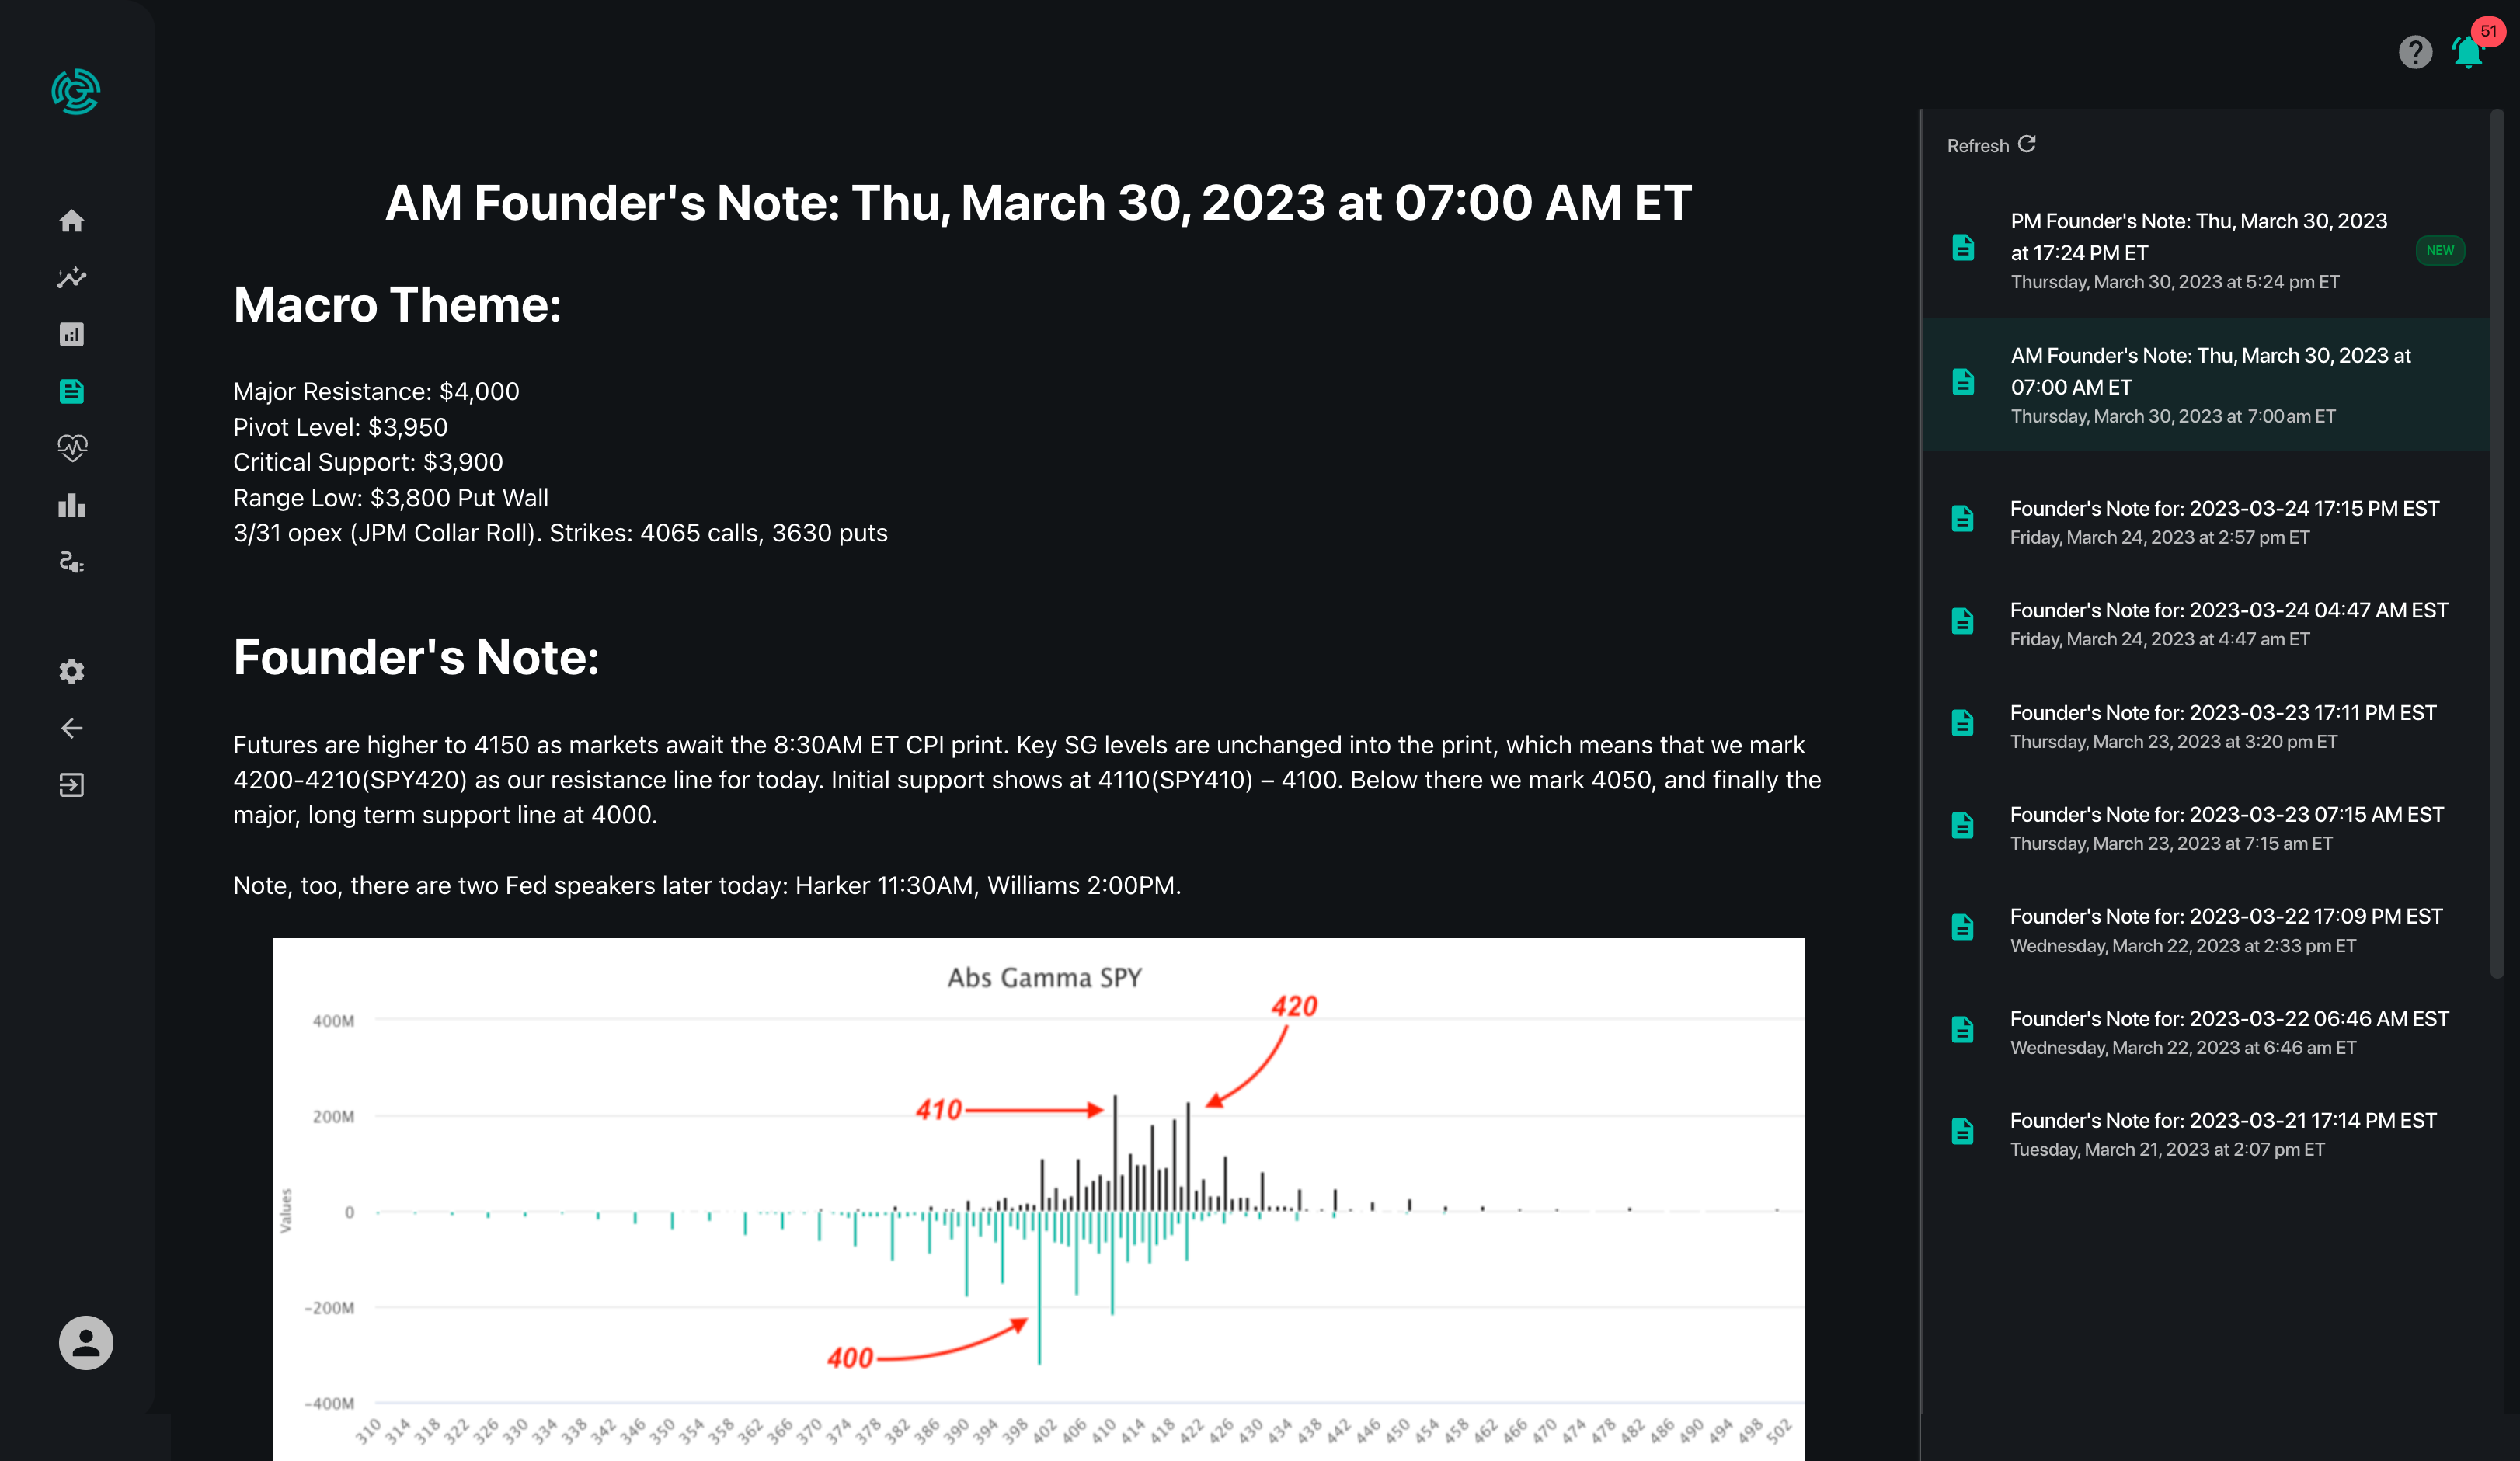
The popularity of the QQQ ETF has magnified the options cycle and has made knowing Gamma levels vital. These Gamma levels are crucial and must be understood if gauging market direction is important to your investment or trading approach.
SpotGamma refers to the most significant concentration of Gamma as Absolute Gamma, which tends to be where the market may gravitate towards when heading into an options expiration.
Another critical level which has been frequently tested is the Put Wall, which is a region that has the most significant net negative Gamma in an underlying stock or index. Over the past few months, the Put Wall has come into play working to drag the market lower or acting as support.
Additionally, the Volatility Trigger detects the levels at which the position of an options Market Maker may shift from positive Gamma to negative Gamma, which can sometimes act as support or resistance.
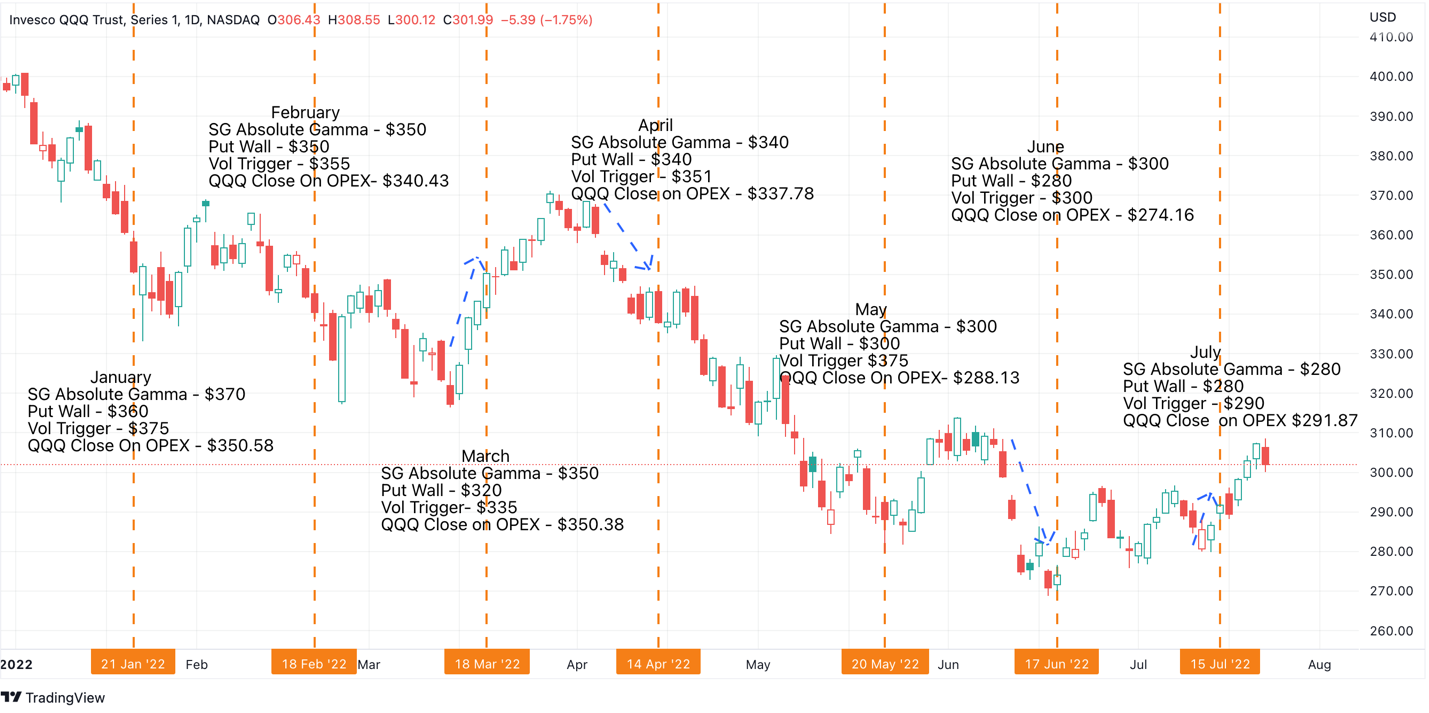
The most recent example of how the Absolute Gamma level or Put Wall came into play occurred on June 8, 2022. The QQQ ETF was trading around $307, heading into options expiration on June 17. The combination of a hot CPI and the sudden change in market expectations for the upcoming FOMC meeting led to a violent sell-off. The Absolute Gamma level at $300 began dragging the QQQ lower.
When the market moved below the Absolute Gamma level, the Put Wall at $280 appears to have helped to support the market, holding the QQQ to around $275, as traders were likely monetizing the profits on their puts and selling their now in-the-money options, forcing Market Makers to buy back their hedges.
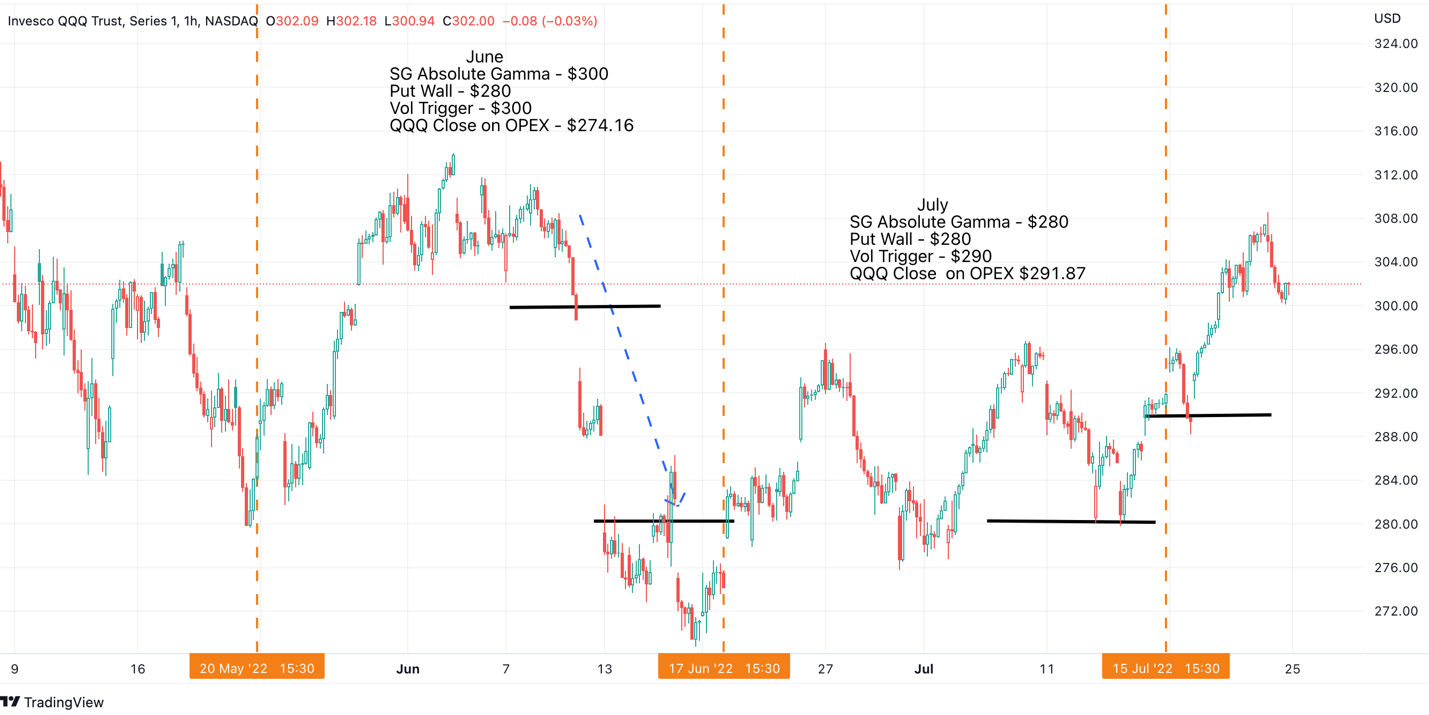
July’s expiration told a different tale. With the QQQ ETF trading around $280 on the morning of July 13, 2022, the Absolute Gamma level at $280 helped to support the ETF. With this support holding, the QQQ rocketed higher in the final three days of trading into options expiration to close at $291.87, bringing the ETF right to the Volatility Trigger, which was around $290.
Seen below, similar events occurred in both March and April.
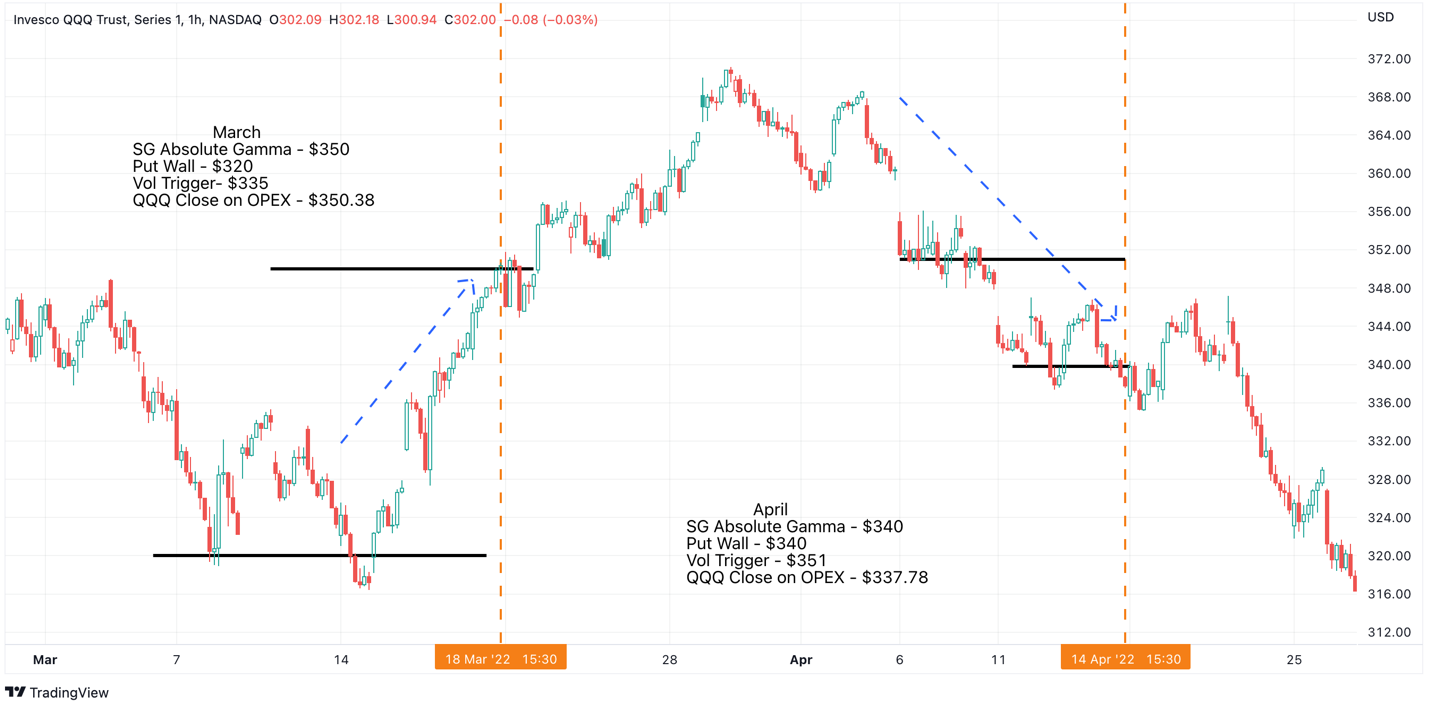
This demonstrates the power of these Gamma levels and more importantly, the need to understand where they are. A market trading too far above or too far below the Absolute Gamma strike price will likely revert back to that big Gamma strike price. Meanwhile, if the market trades too far below the Put Wall, it will probably be pulled back up as traders monetize their short bets, with the same holding true for the Volatility Trigger.
These three significant Gamma levels have been in play this year mainly because the market has been trending lower. If the market had been trending higher, the Call Wall, which functions similarly to the Put Wall, can keep a lid on a rising market.
For example, the Call Wall and the Absolute Gamma level have been at 4,000 since July 18. To this point, they have served as the top of the recent rally. Unless that Call Wall starts to roll higher, it is unlikely that the market can continue to advance.
In 2022, it seems that finding an edge of any kind during periods of extreme volatility and markets trending lower is a salient endeavor. These Gamma levels play a huge role in market direction and tools such as the ones provided by SpotGamma have proven to be fantastic as part of one’s trading arsenal, in QQQ and beyond.