Macro Theme:
Major Resistance: $4,260 (SPY $425 Call Wall)
Pivot Level: $4,200
Interim Support: $4,200
Range High: $4,300 Call Wall
Range Low: $4,000 Put Wall
‣ QQQ Call Walls ($350) continue to roll higher, implying better relative upside performance
Founder’s Note:
Futures are down 30bps to 4,200. 4,200 is our
pivot level, with first resistance above at 4,230 (SPY 422) then 4,250. Support below shows at 4,175 & 4,150.
In QQQ, 350 is the
pivot with resistance at 355 & light support at 345. More material support is at 340.
We think its likely that upside momentum has been temporarily lost as the major indicies digest the major upside strikes of 350 QQQ & 4200 SPX.
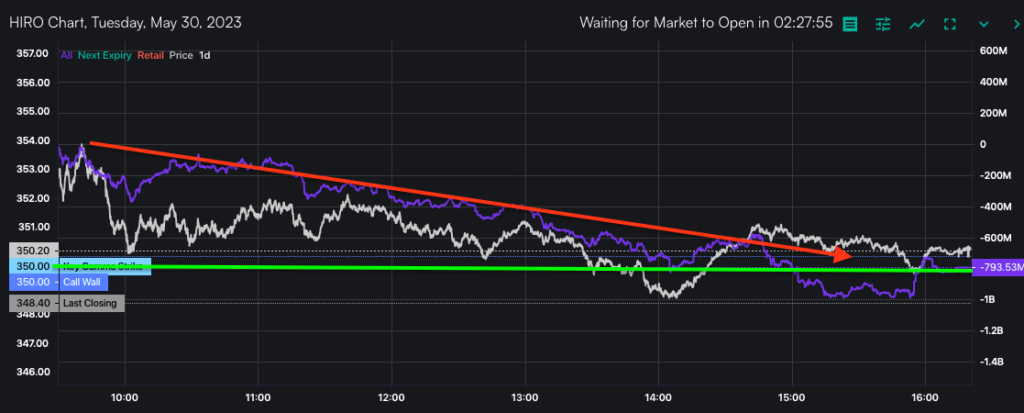
The consolidation in prices yesterday was warranted, as the premarket QQQ 350
Call Wall break implied tech was overextended. With that, we saw fairly heavy negative delta flow on the open until the QQQ closed back down to its 350
Call Wall. The QQQ
Call Wall did roll higher to 360 today, however this is due to traders adding puts to the 350 line. These puts being added could be considered constructive, as we read moderate ATM puts being added as helping to support price.
Over to the S&P, 420 SPY/4,200 SPX is the major level on the board, and has been a major resistance line for several months. Yesterday negative delta option flow (all expiration = purple, 0DTE = teal) initiated on the opening high over 4,200 (red arrow), but positive delta responses were generated on tests <=4,200 (green arrows).
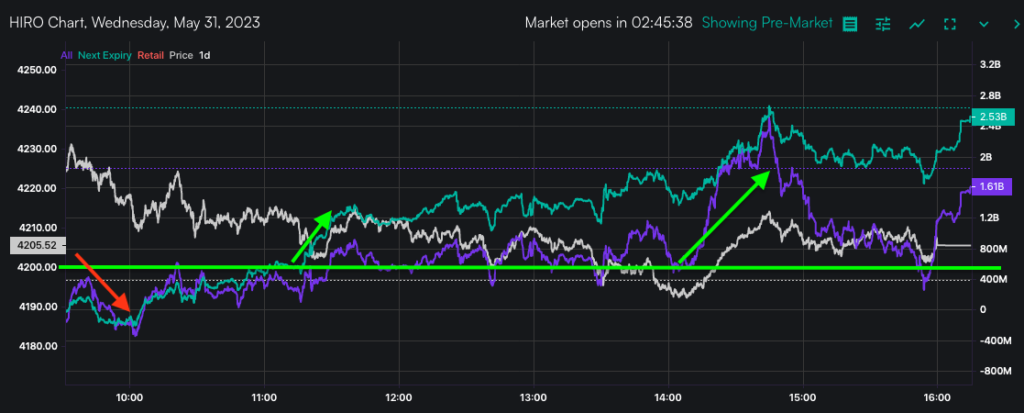
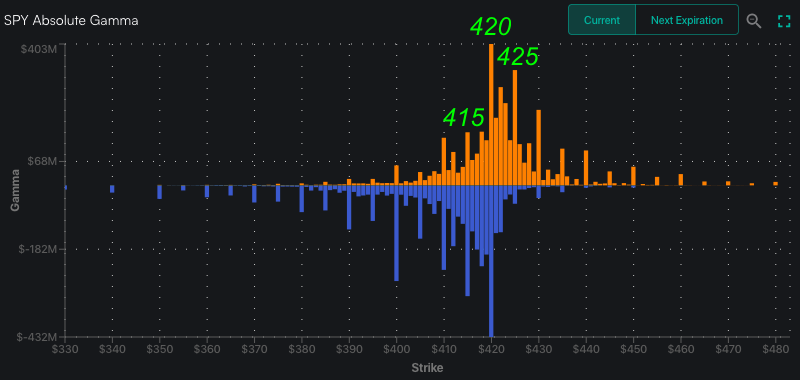
This highlights the concept of the “
pivot” wherein options flow leads to mean reversion into a strike with large options positions – in this case 420/4,200. As you can see below, there are predominantly call positions(orange) above 420, while call & put (blue) positions are more balanced <=420. This suggests that the market should have fairly strong support into the 415/4,150 area, which helps to contain downside volatility.
With futures indicating a cash open below 4,200, we may see 4,200 as resistance for today, and we default to looking for mean reversion between 4,150 – 4,200. To the upside we remain bullish on a close >4,200.
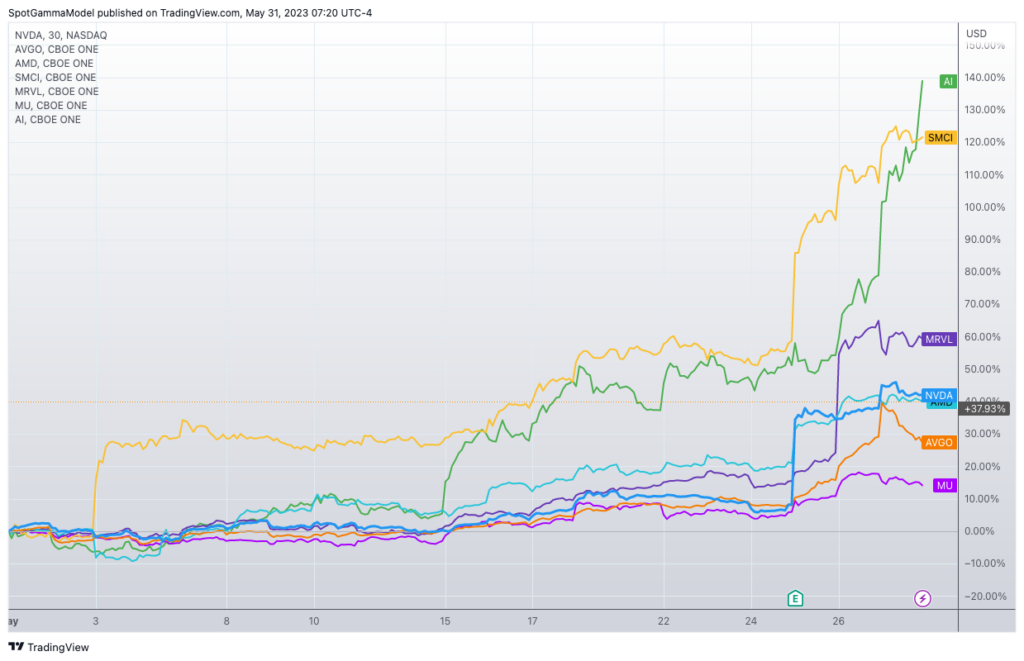
From an options perspective the AI space is now swimming against the current. This is because the massive moves over the last several days significantly lifted implied volatility resulting in much higher call prices. To support those elevated call values the upside stock momentum has to continue, otherwise those call values fall rapidly. Even a pause in stock price can drain off IV, zapping call prices. In theory lower call prices spark negative delta hedging flow, which could lead to options liquidity providers selling stock.
You can see many of these top AI names started to turn yesterday, but with ticker “AI” continuing its squeeze. “AI” reports tonight, and traders were likely trying to front run a “presumed” earnings blowout. While options are turning against these names, we suppose another AI-linked big-earnings-beat could restart the AI mania.
| SpotGamma Proprietary Levels | SPX | SPY | NDX | QQQ | RUT | IWM |
|---|---|---|---|---|---|---|
| Reference Price: | $4205 | $420 | $14354 | $349 | $1767 | $175 |
| SpotGamma Implied 1-Day Move: | 0.85% | 0.85% | ||||
| SpotGamma Implied 5-Day Move: | 2.34% | |||||
| SpotGamma Volatility Trigger™: | $4175 | $420 | $13175 | $349 | $1770 | $175 |
| Absolute Gamma Strike: | $4150 | $420 | $13850 | $350 | $1800 | $175 |
| SpotGamma Call Wall: | $4300 | $425 | $13850 | $360 | $1790 | $180 |
| SpotGamma Put Wall: | $4000 | $400 | $13750 | $332 | $1700 | $170 |
| Additional Key Levels | SPX | SPY | NDX | QQQ | RUT | IWM |
|---|---|---|---|---|---|---|
| Zero Gamma Level: | $4149 | $419 | $0 | $349 | $1858 | $182 |
| Gamma Tilt: | 1.346 | 0.911 | 3.007 | 0.962 | 0.734 | 0.575 |
| SpotGamma Gamma Index™: | 1.609 | -0.085 | 0.104 | -0.01 | -0.022 | -0.079 |
| Gamma Notional (MM): | $534.336M | ‑$387.352M | $13.925M | ‑$30.819M | ‑$23.267M | ‑$834.726M |
| 25 Day Risk Reversal: | -0.06 | -0.063 | -0.032 | -0.037 | -0.046 | -0.052 |
| Call Volume: | 502.647K | 1.879M | 16.478K | 847.268K | 19.101K | 242.306K |
| Put Volume: | 984.185K | 2.892M | 11.352K | 1.448M | 23.536K | 358.563K |
| Call Open Interest: | 6.457M | 6.901M | 71.492K | 4.658M | 208.109K | 3.476M |
| Put Open Interest: | 12.281M | 13.871M | 61.898K | 9.676M | 355.382K | 7.484M |
| Key Support & Resistance Strikes |
|---|
| SPX Levels: [4200, 4150, 4100, 4000] |
| SPY Levels: [422, 420, 418, 415] |
| NDX Levels: [15125, 15100, 14000, 13850] |
| QQQ Levels: [350, 345, 340, 330] |
| SPX Combos: [(4399,98.11), (4374,77.02), (4349,96.33), (4323,94.42), (4319,94.71), (4302,79.39), (4298,99.63), (4290,83.47), (4285,83.04), (4281,89.89), (4277,96.50), (4269,85.11), (4264,87.95), (4260,90.63), (4256,77.55), (4252,99.65), (4243,89.89), (4239,88.82), (4235,92.58), (4231,92.92), (4227,97.35), (4222,74.67), (4218,89.84), (4214,80.79), (4210,89.32), (4206,75.94), (4201,98.35), (4189,83.19), (4172,76.43), (4155,83.37), (4126,80.08), (4100,84.66), (4054,75.03), (4050,88.84), (4025,75.64), (4004,85.77), (3999,95.51)] |
| SPY Combos: [429.4, 424.78, 419.74, 439.49] |
| NDX Combos: [13853, 14771, 14355, 14556] |
| QQQ Combos: [338.72, 351.31, 333.13, 361.1] |
SPXSPYNDXQQQRUTIWM
SPX Gamma Model
May 31$3,386$3,836$4,286$5,047Strike-$1.6B-$864M-$114M$636M$1.4BGamma NotionalPut Wall: 4000Call Wall: 4300Abs Gamma: 4150Vol Trigger: 4175Last Price: 4205
©2023 TenTen Capital LLC DBA SpotGamma
All TenTen Capital LLC DBA SpotGamma materials, information, and presentations are for educational purposes only and should not be considered specific investment advice nor recommendations. Futures, foreign currency and options trading contains substantial risk and is not for every investor. An investor could potentially lose all or more than the initial investment. Risk capital is money that can be lost without jeopardizing one’s financial security or lifestyle. Only risk capital should be used for trading and only those with sufficient risk capital should consider trading. Past performance is not necessarily indicative of future results. VIEW FULL RISK DISCLOSURE https://spotgamma.com/model-faq/disclaimer/