The S&P 500 pulled back slightly last week, and the market’s recent volatility compression phase appears ready for a reset. With earnings season largely over, both index and single stock volatility have dropped from the elevated levels that prevailed earlier this summer.
Our pre-market Founder’s Note on Friday explained how substantial short-options positions cleared with the monthly OPEX. As these contracts expired, stabilizing dealer positions rolled off with them. The reduction in dealer gamma now facilitates more free price movement across both index and single stocks.
As we discussed in a recent CNBC interview, the market appears positioned to pivot from volatility compression to volatility expansion. The removal of stabilizing positions from OPEX, cheap options prices, and high-profile catalysts ahead could set the tone for more turbulent weeks ahead compared to what the market has priced in.
Index Implied Volatility Approaches Yearly Lows
Data from this past week has confirmed that implied volatility may be increasingly compressed. From our Compass heatmap shown below, SPY currently shows an IV Rank of 14%, suggesting very cheap options prices relative to the past year.
Moreover, we observe that IV for other major S&P 500 names has decreased to the lower end of the quadrant. This vol compression marks a stark shift compared with pre-earnings season a month ago.
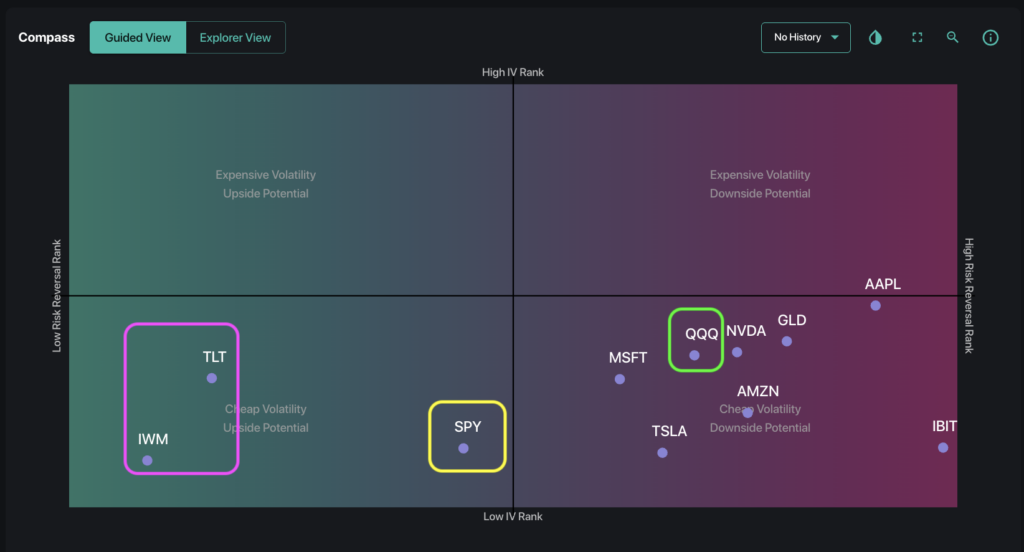
Interestingly, the market has begun to display signs of divergence in trader sentiment across the major indices. Traders appear to have hedged positions in IWM with heavier put skew, as small caps are oftentimes the most sensitive to rate uncertainty.
On the other hand, broad tech and AI optimism remains prevalent — driving call skew for QQQ. SPY options positioning remains relatively neutral.
Low implied volatility means that traders have grown comfortable shorting volatility rather than owning it. When this behavior reaches extremes, the market has a tendency to mean-revert — meaning a noteworthy catalyst could spark an uptick in options buying.
Market Calendar Picks Up Through September
Two major catalysts arrive next week: NVDA earnings, and the Jackson Hole summit. NVDA reports earnings on Wednesday, August 26, after the close with the options market implying a move of roughly 5%. Two days later, Fed Chair Kevin Warsh will deliver his first Jackson Hole keynote at 10am ET on August 28.
From our Volatility Dashboard, Forward IV on these two days appears elevated compared with the Term Structure. This indicates potential jump risk if NVDA earnings or Warsh’s speech surprise the market.
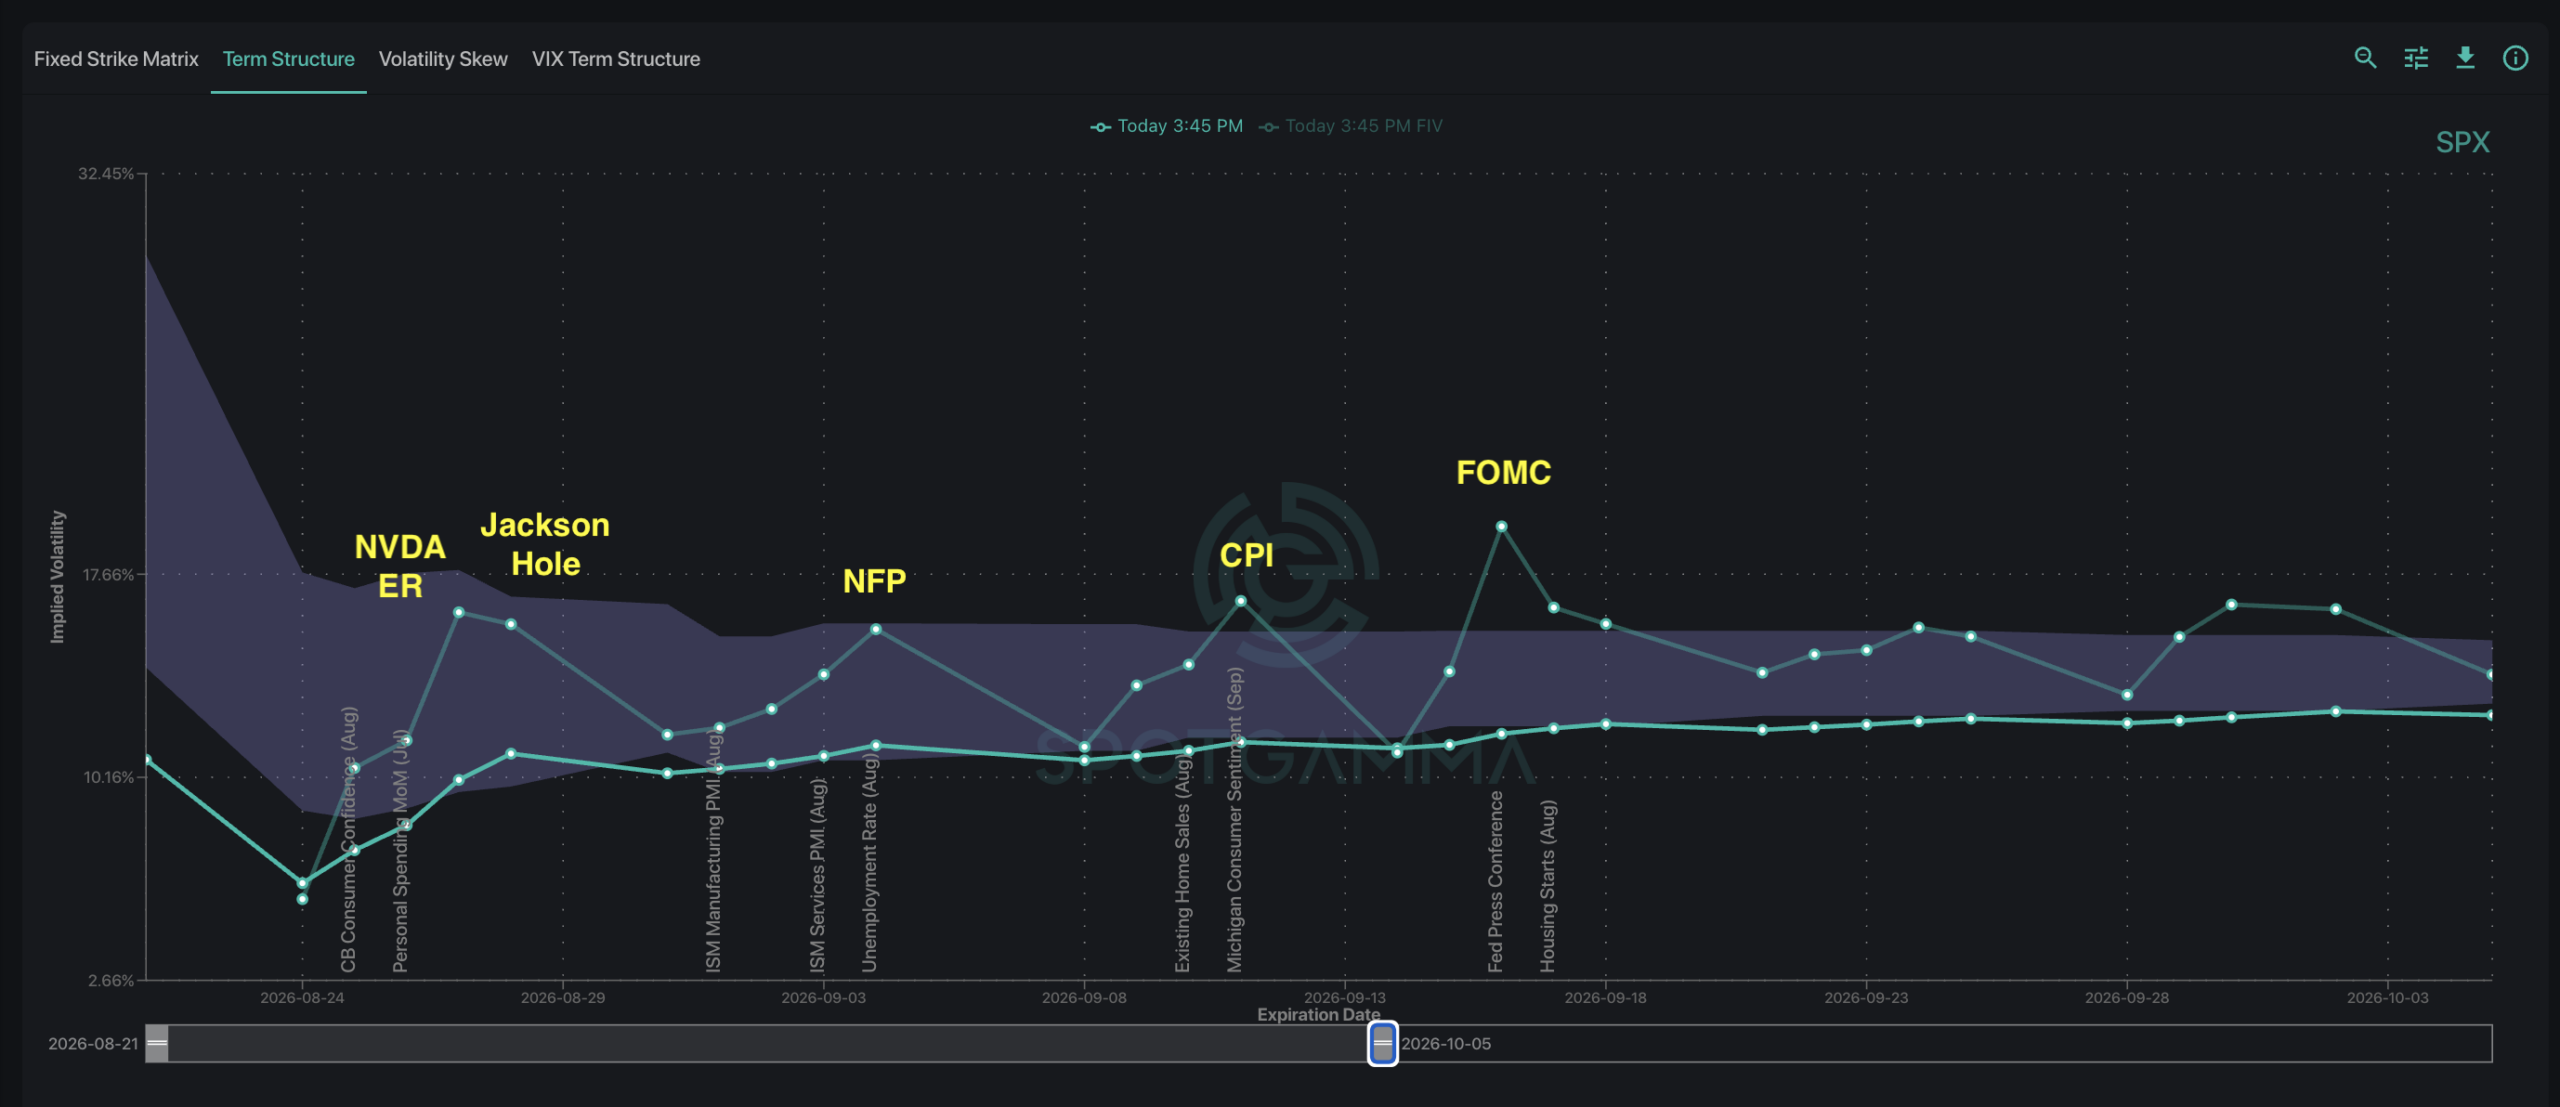
Zooming out, the event calendar stays dense for the weeks following Jackson Hole: NFP on September 4, CPI on September 11, and the next FOMC decision on September 16. Forward implied volatility remains elevated around each of these dates.
The upcoming calendar – combined with current lows in IV – indicate potential trigger events for a vol spike. Traders should remain cognizant of these dates when structuring longer-dated trades.
All Eyes On NVDA Earnings
NVDA earnings deserve particular attention as the largest stock by market cap, and the options market appears constructive. Our Synthetic OI model shows light positive dealer gamma to the downside creating support, with negative dealer gamma to the upside potentially fueling a post-earnings rally.
The 195 strike is particularly interesting: traders are currently short 84k lots of the 195-strike puts, suggesting conviction that the level will hold. That level of put selling could easily cushion a post-earnings dip.
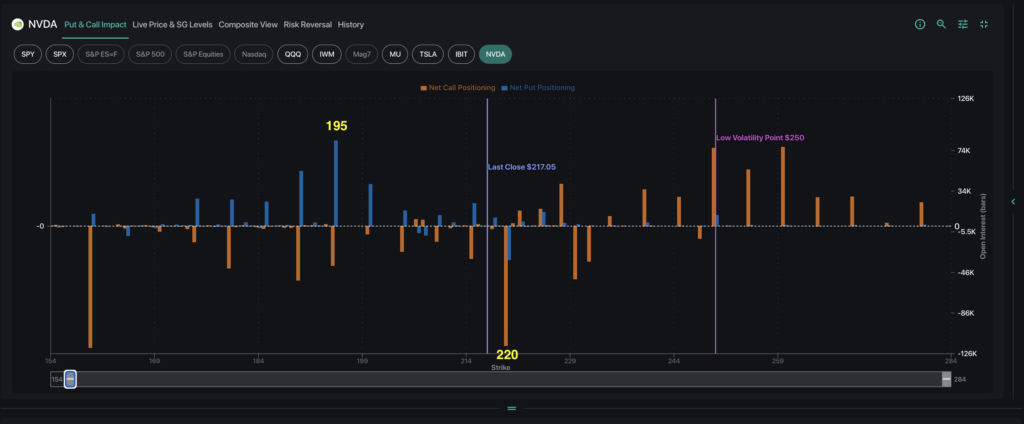
Above the current spot, the largest call open interest position sits at the 220 strike, where traders are net long 118k lots calls. This level could act as both a price magnet on a positive earnings reaction and a point of friction as dealers hedge upwards, fueling a potential rally.