• Skip to main content
  • Skip to primary sidebar

SpotGamma™

S&P 500 Stock Market Gamma Trading Levels Based on Options Open Interest

  • About
  • Pricing
  • Academy
  • Resources
    • Tool Demos
    • Case Studies
    • Blog
    • Support Center
    • Free Daily Report
    • Free Trading Tools
      • Options Profit Calculator
      • SPX Gamma Exposure
      • Implied Earnings Moves
      • Volatility Ranking
    • Free Training
    • Report Card
  • Login

Apr 27 2026

How to Trade GEX Flips: An Intraday Masterclass Using SpotGamma TRACE

One of the most profitable setups in options-land is the GEX Flip—the moment a market transitions from a stable, “pinned” environment into a high-volatility “squeeze” or “slide.” Using the TRACE charts from April 23, 2026, we can see exactly how this transition occurs in real-time.

Stage 1: The Stable Open (9:30 AM EST)

At the open, the TRACE map is all blue.

The Signal: Large Positive GEX across all SPX strikes.

The Trade: In this regime, market makers are “long gamma.” They buy dips and sell rallies to remain delta-neutral. This creates a gravitational “pin” that suppresses volatility. Traders should expect a flat, range-bound session.
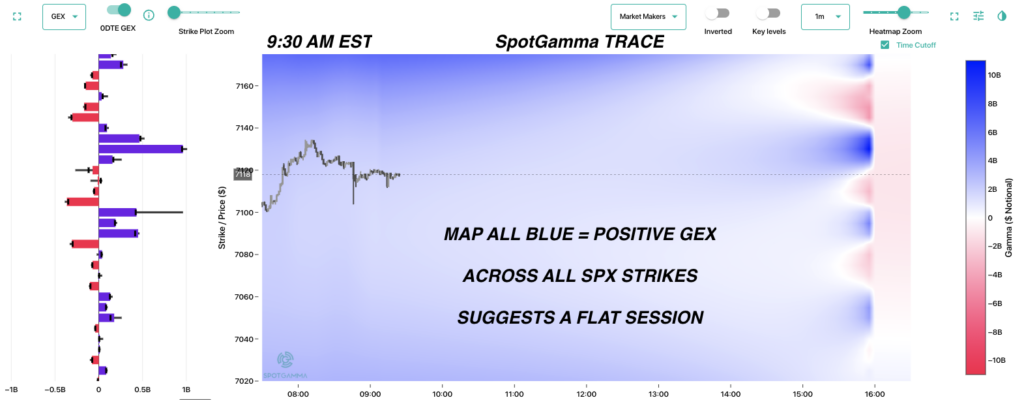
SpotGamma TRACE chart showing intraday GEX stable positive gamma.

Stage 2: The Pocket Forms (1:00 PM EST)

By mid-day, the map begins to shift. While the top remains blue, a “Flat to Negative GEX” pocket begins to open up below the current price, specifically around the 7,050 strike.

The Signal: White/Red pockets appearing on the heatmap.

The Warning: The market is losing its supportive floor. If a catalyst hits, there is no “gamma buffer” to slow the descent.
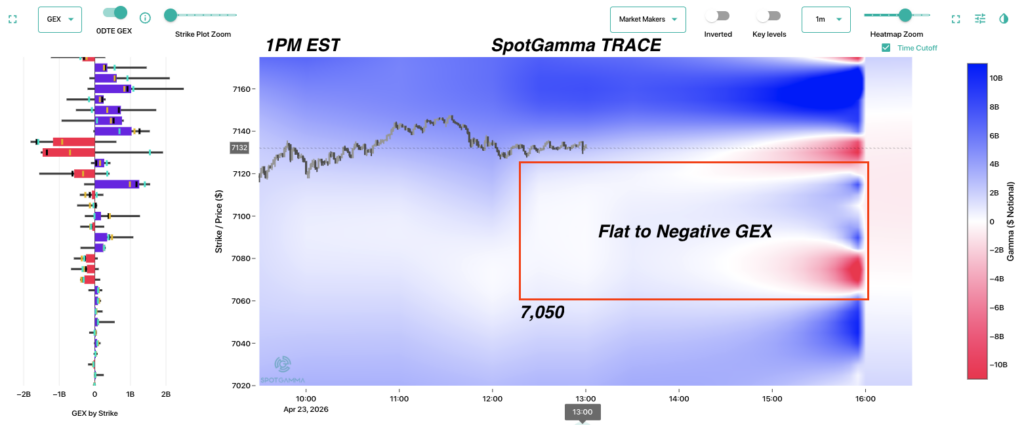
SpotGamma TRACE chart showing intraday GEX flip and negative gamma pocket.

Stage 3: The Headline Slide (1:45 PM EST)

A sudden headline triggers a sell-off. Because the market just moved into that Negative GEX pocket, market makers must now flip their behavior.

The Signal: Price slices through the “white zone” into the red.

The Mechanic: In negative gamma, dealers must sell into weakness to hedge. This accelerates the move. Notice how the SPX moves exactly through the red pocket until it hits the 7,050 support level, where positive gamma (blue) still exists.
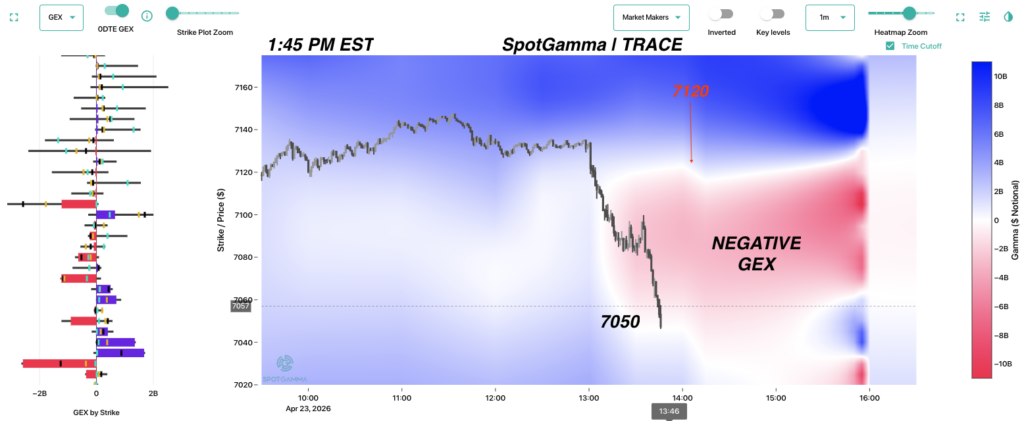
SpotGamma TRACE chart showing intraday GEX flip and the SPX filling down into the negative gamma pocket.

Stage 4: The Rip Back to Equilibrium (4:00 PM EST)

Once the 7,050 floor holds, the “oversold” snap-back occurs.

The Result: The market rips higher, fueled by short-covering, and heads directly back to the 7,120 level—exactly where the overhead positive gamma concentration had formed earlier in the day.
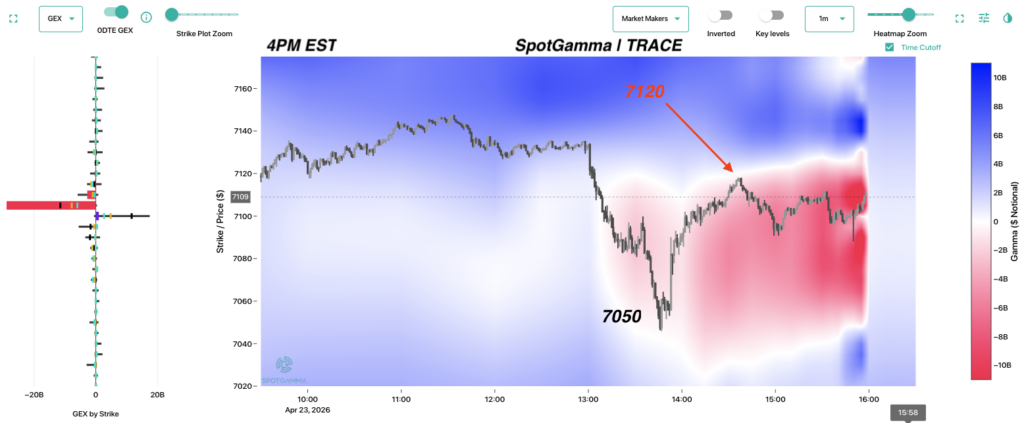
SpotGamma TRACE chart showing intraday negative gamma zone.

The “GEX Flip” Trading Checklist

1. Identify the Regime: Is the map solid blue (stable) or are red pockets forming?

2. Find the “Vacuum”: Negative GEX pockets act as volatility vacuums. Price will move through them faster than blue zones.

3. Target the Nodes: Use the Strike Plot (left side of TRACE) to find the largest blue bars. These are your ultimate support and resistance targets for the day.

Want to see these pockets before they break?

Explore SpotGamma Alpha for real-time TRACE access.

Share This Article

  • Share
  • Twitter
  • LinkedIn
  • Reddit
  • Facebook

Written by SpotGamma · Categorized: Market Analysis

Don’t have an account with SpotGamma?

Choose the plan you want today to view unique support and resistance levels, access Founder’s Notes and expert commentary, daily trading ranges, and entrance into our private Discord.


Primary Sidebar

Related Resources

  • Welcome to the Summer Melt-Up

    Welcome to the Summer Melt-Up

    August 9, 2026
  • The Machine Ran on Call Skew: What MSTR’s Dead Volatility Surface Says About Strategy — and Bitcoin’s Missing Bid

    The Machine Ran on Call Skew: What MSTR’s Dead Volatility Surface Says About Strategy — and Bitcoin’s Missing Bid

    August 3, 2026
  • The New Normal in Volatility Takes Shape

    The New Normal in Volatility Takes Shape

    August 2, 2026
  • Anatomy of a Margin Call: How Situational Awareness LP Unwound a $20 Billion AI Book in One Trade

    Anatomy of a Margin Call: How Situational Awareness LP Unwound a $20 Billion AI Book in One Trade

    July 30, 2026
  • Big Tech Earnings and FOMC Collide

    Big Tech Earnings and FOMC Collide

    July 26, 2026
  • youtube
  • x
  • Privacy Policy
  • Disclaimer
  • Terms & Conditions
  • Support Center
  • Media
  • Contact Us

©2026 TenTen Capital LLC DBA SpotGamma

All SpotGamma materials, information, and presentations are for educational purposes only and should not be considered specific investment advice nor recommendations. Futures, foreign currency and options trading contains substantial risk and is not for every investor. An investor could potentially lose all or more than the initial investment. Risk capital is money that can be lost without jeopardizing one's financial security or lifestyle. Only risk capital should be used for trading and only those with sufficient risk capital should consider trading. Past performance is not necessarily indicative of future results. Testimonials appearing on this website may not be representative of other clients or customers and is not a guarantee of future performance or success.

View Full Risk Disclosure