Gamma exposure (GEX) is an options-market-structure measure that estimates the aggregate gamma held by dealers. It shows how quickly dealer hedges may rebalance as price moves: positive GEX can stabilize, negative GEX can amplify. It does not predict direction. SpotGamma models this with an Options Inventory Model and intraday 0DTE flow (Cboe: 0DTE was 59% of SPX volume in 2025).
Positive dealer gamma can make rebalancing flows more stabilizing; negative dealer gamma can make them more amplifying. GEX describes market structure and volatility sensitivity—not the market’s next direction—and every public GEX figure depends on modeling assumptions.
GEX at a glance
| Positive modeled dealer GEX Rebalancing may lean against price moves | Negative modeled dealer GEX Rebalancing may move with price |
| Best use Volatility-regime and level context | Not a standalone signal Does not predict direction or guarantee a hedge trade |
| How to trade GEX: practical setups and risk controls | View the free SPX GEX chart |
Static Options Data Won’t Tell You What Dealers Will Do Next
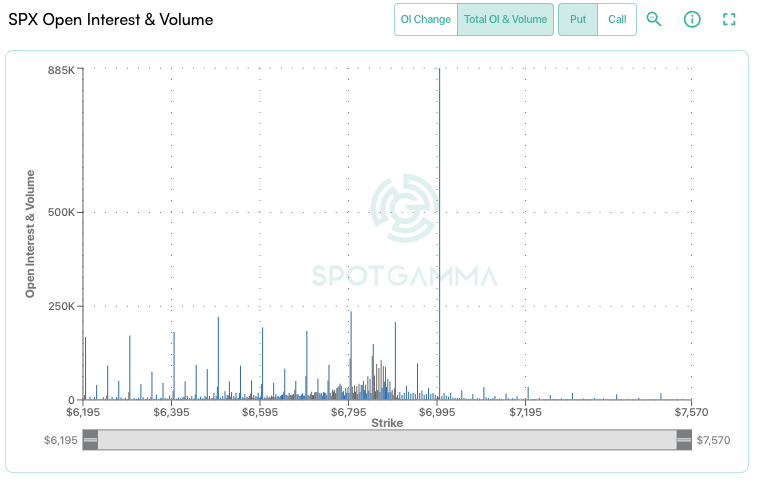
Open interest, option chains, and put/call ratios describe visible contracts and activity, but public data does not identify the participant holding each side. Dealer gamma hedging is therefore estimated rather than directly observed.
Static OI Chains Miss Intraday Changes
Official open interest is a prior-night snapshot and remains static intraday. Hedge positions and new trades can change during the session, so a static OI model can become stale; an intraday model must estimate those changes.
Naive GEX Models Ignore Dealer vs. Customer
Basic OI-based GEX calculations assign position signs using a convention because public OI does not identify dealer versus customer ownership. That convention can be useful, but it is still an assumption.
Single-Expiry Models Are Dangerously Incomplete
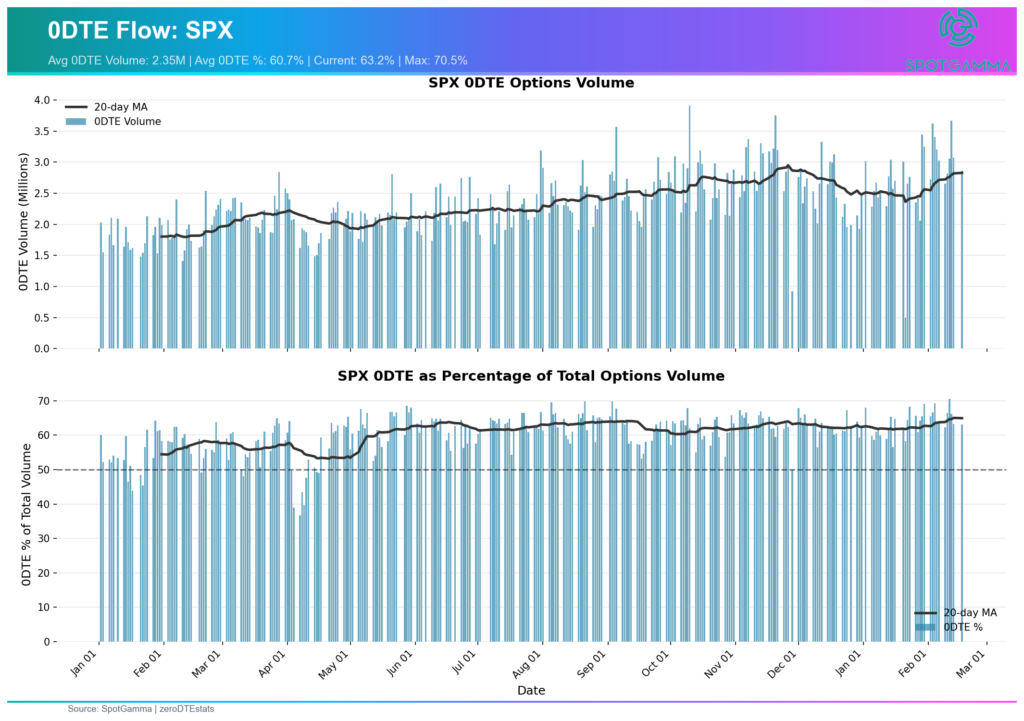
Focusing only on monthly expiry omits same-day positions. Cboe reports that 0DTE contracts represented 59% of SPX options volume in 2025; volume is not the same as net dealer exposure, but the share makes expiry coverage material to an intraday model.
No Signal for When Volatility Will Spike
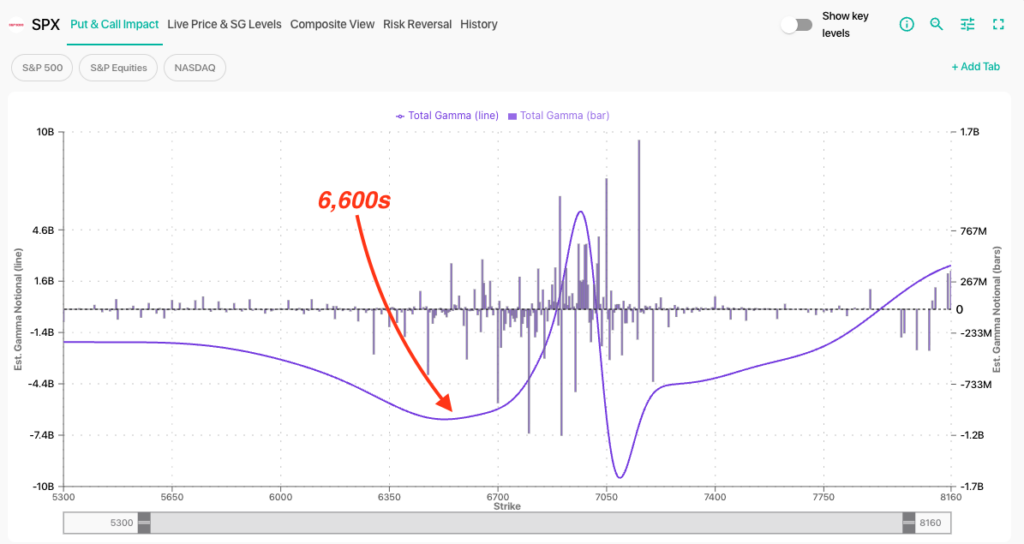
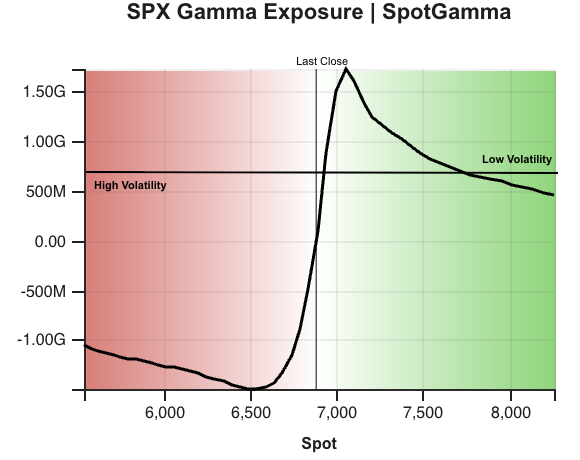
An aggregate number does not show where the modeled profile changes. A price-level curve can identify estimated crossovers and concentration zones, but no exact level guarantees that a calm market will become volatile.
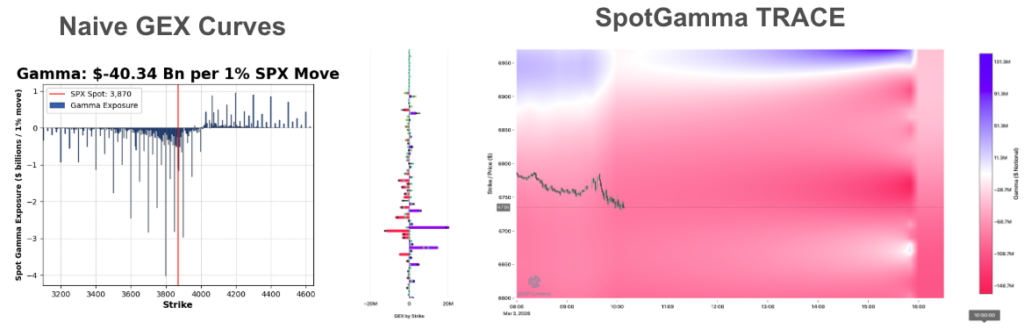
This comparison shows a basic OI-based GEX model beside SpotGamma’s TRACE application. A basic model applies fixed position assumptions to official OI. SpotGamma says TRACE adds its proprietary Options Inventory Model and intraday trade data, including 0DTE activity, to estimate how positioning changes during the session.
What Is Gamma Exposure (GEX)?
Gamma exposure (GEX) estimates the aggregate gamma of modeled dealer option positions across the strikes and expirations included by a provider. Gamma itself measures how much an option’s delta changes for a $1 move in the underlying, as explained by the Options Industry Council.
If dealers rebalance delta hedges, a positive aggregate gamma position generally implies selling some underlying exposure after price rises and buying after it falls. A negative aggregate gamma position reverses that modeled response. Actual hedge timing and size are not publicly observable and can differ because firms net risk across strikes, expirations, underlyings, and related products.
GEX can therefore help answer, “How sensitive might the market be to hedge rebalancing around this price?” It cannot answer, by itself, “Will the market go up or down?”
How Gamma Exposure Is Calculated
A transparent GEX calculation needs a spot price, option gamma (or the inputs needed to estimate it), contract counts, a contract multiplier, included strikes and expirations, and—most importantly—an assumption or model for the sign of dealer inventory.
| Input | What it controls | Important limitation |
|---|---|---|
| Unit gamma (Γ) | Delta change for a $1 underlying move | Changes with spot, volatility, and time |
| Modeled dealer position | Long-gamma (+) or short-gamma (−) sign | Public OI does not identify the holder |
| Contract multiplier | Converts one option to underlying units | Usually 100, but product specifications govern |
| Spot price and scale | Converts gamma to dollar exposure | Per-$1 and per-1% figures are not interchangeable |
| Strikes and expirations | Defines the aggregation universe | Different filters produce different totals |
Dollar GEX Formula
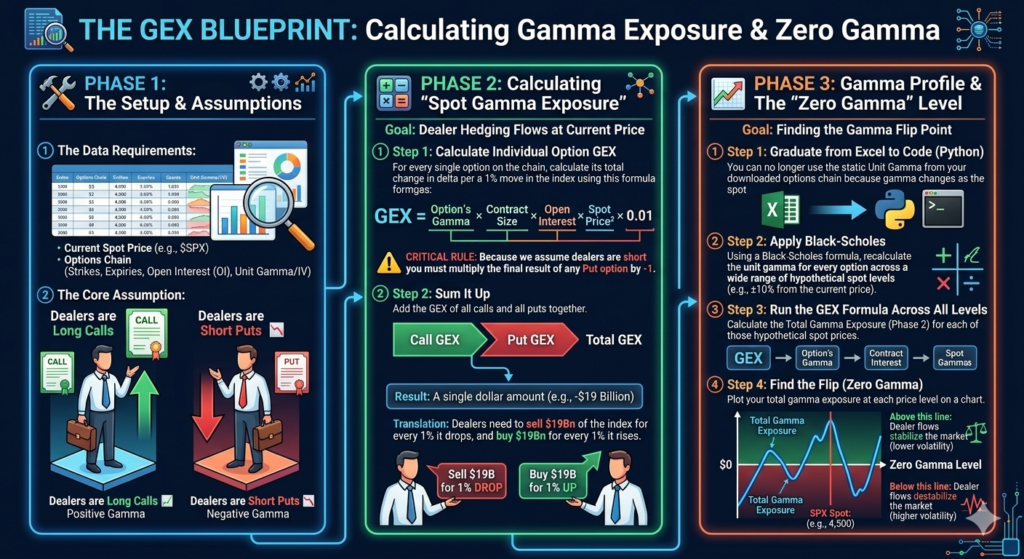
Dollar GEX per 1% move = Γ × modeled dealer position × contract multiplier × spot² × 0.01
The modeled position is positive when estimated dealer inventory is long gamma and negative when it is short gamma. Long calls and long puts have positive gamma; short calls and short puts have negative gamma. A call-positive/put-negative public-data formula is a simplifying inventory convention—not a rule of option mathematics and not a direct observation of every dealer book.
Official open interest is based on prior-night data and remains static during the trading session, according to the Cboe DataShop FAQ. A provider that estimates intraday inventory must add trade classification and other proprietary assumptions.
Worked GEX Example
Assume a $200 stock, unit gamma of 0.02, an estimated long-gamma dealer position of 1,000 contracts, and a 100-share multiplier. A 1% stock move is $2.
- Delta sensitivity per $1 move: 0.02 × 1,000 × 100 = 2,000 shares.
- Delta change for a 1% move: 2,000 × $2 = 4,000 shares.
- Dollar GEX: 4,000 × $200 = $800,000 per 1% move.
- Equivalent formula: 0.02 × 1,000 × 100 × $200² × 0.01 = $800,000.
If this modeled dealer position is long gamma and the stock rises 1%, a fully delta-neutral local approximation implies selling about 4,000 shares; after a 1% decline, buying about 4,000. A short-gamma position reverses the modeled direction. This is a sensitivity estimate—not a guaranteed trade amount, forecast, or claim that hedging happens all at once.
GEX per $1 Move vs. per 1% Move
Some charts report delta change for a $1 underlying move; others convert it to dollar notional for a 1% move. The spot² × 0.01 terms make the latter conversion. Always check the units before comparing values from two sources.
Calculating the Zero Gamma Level
Gamma changes as spot, implied volatility, and time change. To estimate Zero Gamma, recalculate option gamma over a range of hypothetical spot prices, aggregate the position-signed exposure at each price, and locate the modeled crossover through zero. The answer changes when the provider changes its inventory assumptions, expiry filters, volatility inputs, or intraday adjustments.
Positive Gamma vs. Negative Gamma: Opposite Market Dynamics
The sign of modeled net GEX provides conditional information about potential hedge rebalancing. It does not determine direction or override liquidity, events, volatility, and new flow.
Positive Gamma: Potentially Stabilizing Rebalancing
When modeled dealer GEX is positive, delta-neutral rebalancing generally means selling some underlying exposure as price rises and buying as it falls. All else equal, that counter-cyclical flow can attenuate moves and contribute to lower realized volatility or mean reversion.
- Intraday ranges may compress.
- Moves into gamma-heavy strikes may slow, pin, or reverse.
- Event risk, new flow, liquidity, and macro catalysts can overwhelm the modeled effect.
Negative Gamma: Potentially Amplifying Rebalancing
When modeled dealer GEX is negative, delta-neutral rebalancing generally means buying more underlying exposure as price rises and selling more as it falls. That pro-cyclical flow can exacerbate an existing move and contribute to wider realized ranges.
- Intraday ranges may expand.
- Breakouts or breakdowns may become harder to fade.
- Negative GEX still does not specify whether the initiating move will be up or down.
A First-Party GEX Example: February 26, 2026
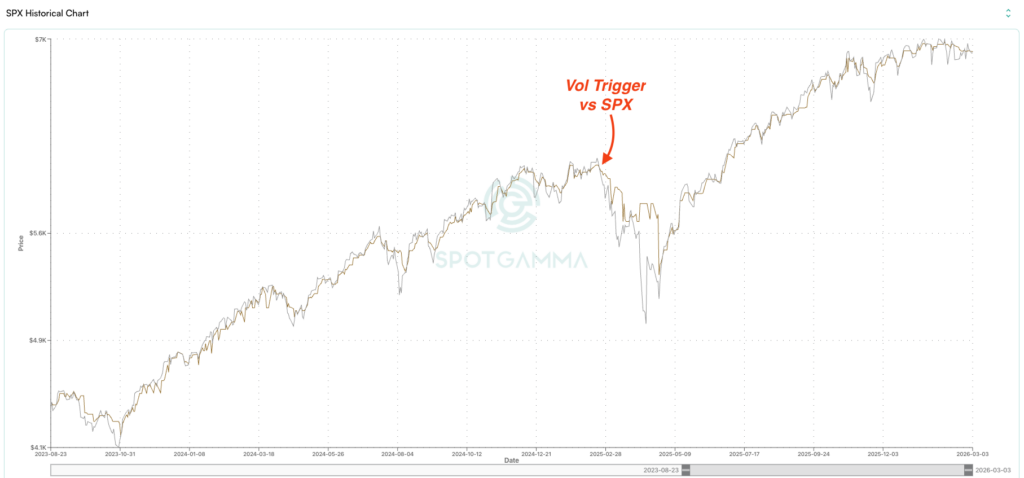
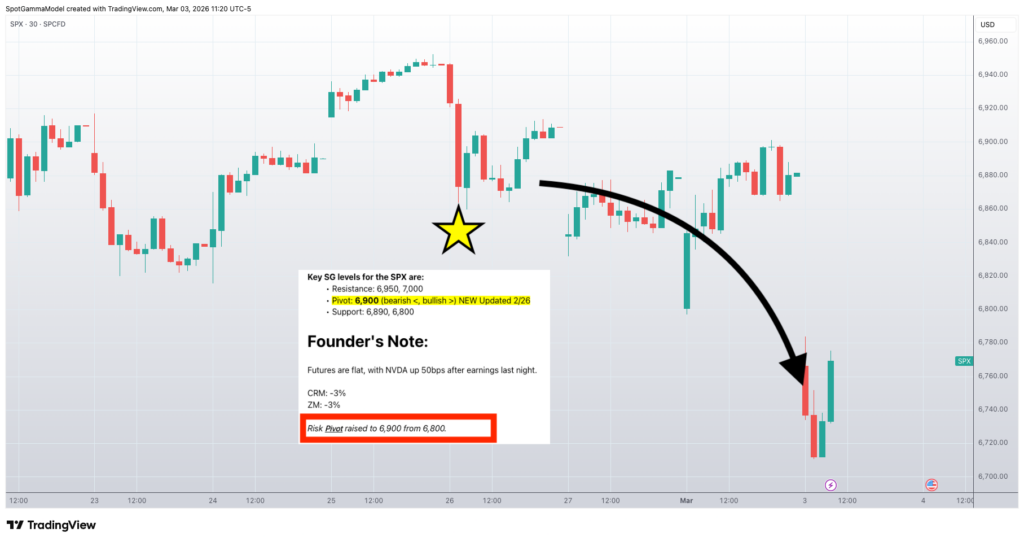
On February 26, 2026, SpotGamma’s morning analysis raised its SPX Risk Pivot from 6,800 to 6,900 as its model showed negative gamma building below spot. SPX subsequently moved below SpotGamma’s Volatility Trigger, declined about 2%, and VIX reached 28.
This example shows the intended use: the model described greater sensitivity to a decline after price crossed a modeled regime level. It did not predict the initiating direction, identify every hedge transaction, or prove that gamma caused the entire move. A rigorous case study should preserve the timestamped pre-event note, model snapshot, outcome window, and competing catalysts.
How to Read a GEX Chart
- Check the unit and timestamp. Confirm per-$1 versus per-1%, included expirations, and whether the chart uses prior-day OI or an intraday model.
- Identify the aggregate regime. Positive or negative net GEX provides volatility context, not a directional forecast.
- Locate large strike concentrations. Treat them as scenario levels whose influence depends on price, time to expiry, new flow, and liquidity.
- Watch for a modeled crossover. Zero Gamma or a proprietary trigger can flag a change in estimated hedge sensitivity.
- Confirm with live context. Price, volatility, event risk, and intraday positioning can invalidate a static morning map.
Use the free SPX Gamma Exposure chart to practice, then see how to trade GEX with practical setups and risk controls.
GEX Levels: Zero Gamma, Volatility Trigger, Call Wall, and Put Wall
GEX levels compress a model into reference prices. They are useful for building scenarios, but they are not guaranteed support, resistance, pins, or breakout triggers.
Zero Gamma or Gamma Flip
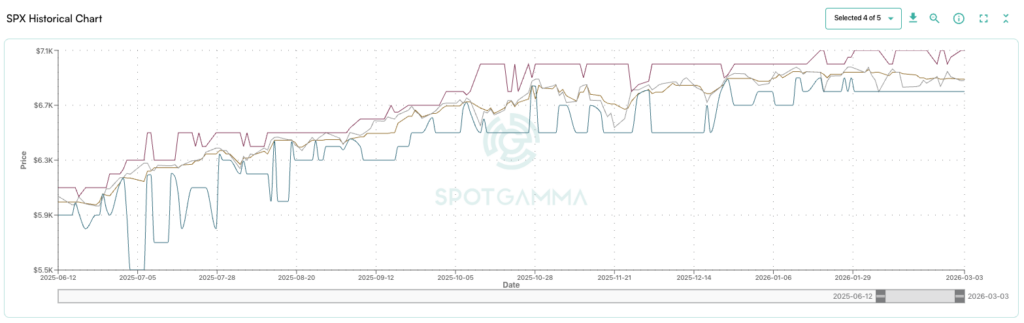
Zero Gamma is the modeled spot price where aggregate GEX crosses zero. It marks a potential change in the direction of delta-hedge rebalancing. Because the level depends on inventory and pricing assumptions, different providers can publish different crossovers.
SpotGamma Volatility Trigger™
The Volatility Trigger is a proprietary SpotGamma level derived from its estimated distribution of gamma rather than a generic zero crossover. SpotGamma uses it as a scenario boundary for changes in modeled volatility sensitivity. A break is context—not proof that dealers have flipped or that volatility must expand.
SpotGamma Risk Pivot
The Risk Pivot is another SpotGamma scenario level used to frame where its modeled market structure may become more or less supportive. Traders can incorporate it into position sizing and invalidation plans, while still accounting for volatility, liquidity, and event risk.
Call Wall
The Call Wall identifies a major modeled call-gamma concentration. It can act as a magnet, resistance reference, or acceleration point depending on who owns the options, time to expiry, and new flow. It should not be treated as an automatic ceiling.
Put Wall
The Put Wall identifies a major modeled put-gamma concentration. It can be a useful downside scenario reference, but public OI cannot prove the dealer-side position and the level is not an automatic floor.
How SpotGamma Estimates GEX
A basic public-data model combines option gamma with prior-day open interest and a rule for assigning position signs. SpotGamma says its products use OPRA data, direct exchange feeds, and proprietary calculations; see where SpotGamma’s data comes from.
| Layer | What it contributes | What remains modeled |
|---|---|---|
| Official open interest | Prior-night contract totals by series | Who owns each side |
| Options Inventory Model | SpotGamma’s estimate of participant positioning | Classification and inventory assumptions |
| Intraday trade data | New flow and same-day activity | Opening/closing status and netting |
| TRACE | Minute-by-minute participant and pressure views described in SpotGamma’s documentation | Estimated positioning rather than audited dealer books |
SpotGamma’s TRACE documentation describes an Options Inventory Model, participant-specific views, and updates every minute. These are first-party product descriptions. They improve timeliness and segmentation, but they do not turn public options data into a literal view of every dealer’s internal book.
Why GEX Values Differ Across Providers
Two legitimate GEX charts can disagree because GEX is a model output, not an exchange-published statistic.
| Model choice | How it changes the result |
|---|---|
| Position-sign convention | Determines which contracts contribute positive or negative exposure |
| Expiry and strike filters | Changes which inventory is included |
| Spot and volatility timestamp | Changes option gamma and the aggregate profile |
| Per-$1 vs. per-1% units | Changes the reported scale |
| Intraday-flow treatment | Changes whether today’s trades adjust prior-day OI |
| Index, ETF, and futures netting | Changes how related hedges are represented |
What GEX Can—and Cannot—Tell You
GEX can help with
- Volatility-regime context
- Potentially important strikes and crossover regions
- Scenario design and risk invalidation
- Comparing how exposure changes through time
GEX cannot prove
- The market’s next direction
- Exact dealer inventory from public OI alone
- The timing or size of an actual hedge trade
- That a wall will hold or a crossover will cause volatility
Cboe’s 0DTE market-impact analysis explicitly notes the difficulty outside observers face when inferring participant positioning. A Cboe-hosted study finds that estimated dealer gamma can relate to volatility, while also showing that effects are conditional and not always large relative to ordinary volatility changes.
GEX History and Research
A dated SqueezeMetrics white paper publicly used the term “Gamma Exposure (GEX)” in March 2016 and was revised in 2017. SpotGamma, founded in 2020, subsequently developed its own dealer-positioning models, named levels, education, and real-time trader tools. That product history is the defensible SpotGamma contribution; the term itself predates the company.
Academic and exchange-hosted research—including Gamma Fragility—supports a relationship between options-market gamma imbalance, hedge rebalancing, and realized volatility. The evidence is probabilistic and sample-dependent, not a guarantee that any one model level will control a session.
Where GEX Fits in Market Analysis
GEX is most useful as a scenario and risk-management input alongside price, implied volatility, liquidity, events, and live flow. For entry frameworks, routines, and invalidation rules, see how to trade GEX: practical setups and risk controls.
Intraday and 0DTE context
Compare spot with modeled concentration levels, then define what would confirm or invalidate a range, breakout, or reversal scenario. In 2025, 0DTE contracts represented 59% of SPX options volume, according to Cboe; volume, however, is not the same as net dealer exposure.
Swing-regime context
Changes in modeled aggregate gamma can help frame whether realized volatility may be more compressed or more sensitive to an initiating move. Use the regime as a conditional input, not an automatic long- or short-volatility instruction.
Portfolio scenario planning
Portfolio managers can incorporate GEX levels into stress tests, hedge-review thresholds, and position-size decisions. GEX does not determine whether protection is cheap, expensive, or necessary; option pricing, correlations, liquidity, and portfolio objectives still govern that decision.
GEX Across Indices, ETFs, Futures, and Single Stocks
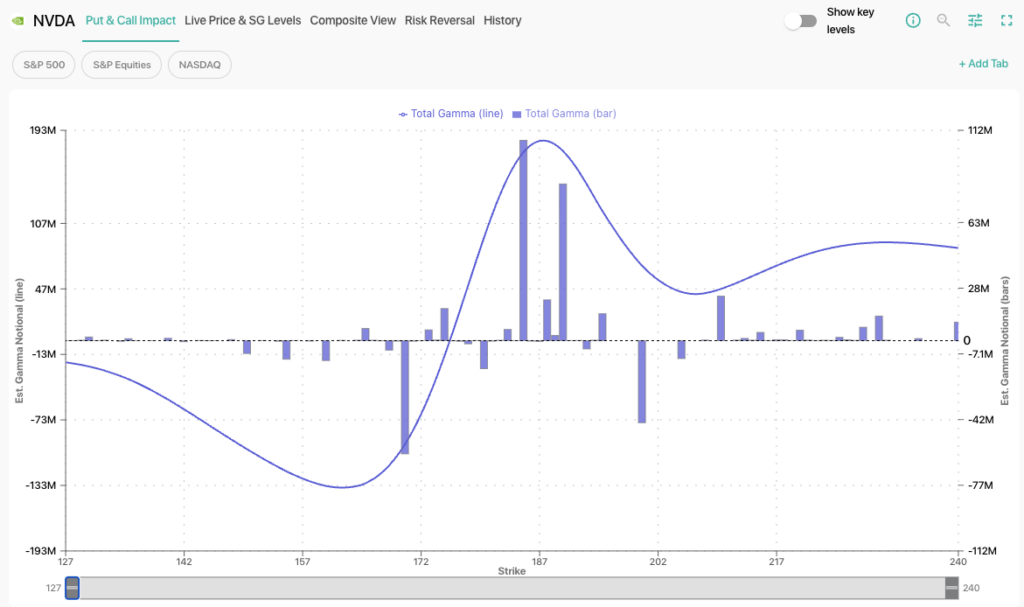
The interpretation is similar across products, but contract specifications, liquidity, participant mix, and related hedges matter. Do not compare raw GEX values across SPX, SPY, QQQ, IWM, futures, or individual equities without normalizing units and methodology.
- SPX: cash-settled index options with heavy daily and 0DTE activity.
- SPY, QQQ, and IWM: ETF options with deliverable shares and a different participant and hedge mix.
- ES futures: a common index-hedging vehicle; an options GEX model does not directly observe every futures hedge.
- Single stocks: earnings, corporate actions, borrow, and concentrated flow can dominate a static gamma map.
Real-Time GEX Gamma Exposure
TRACE: See Dealer Gamma As It Happens
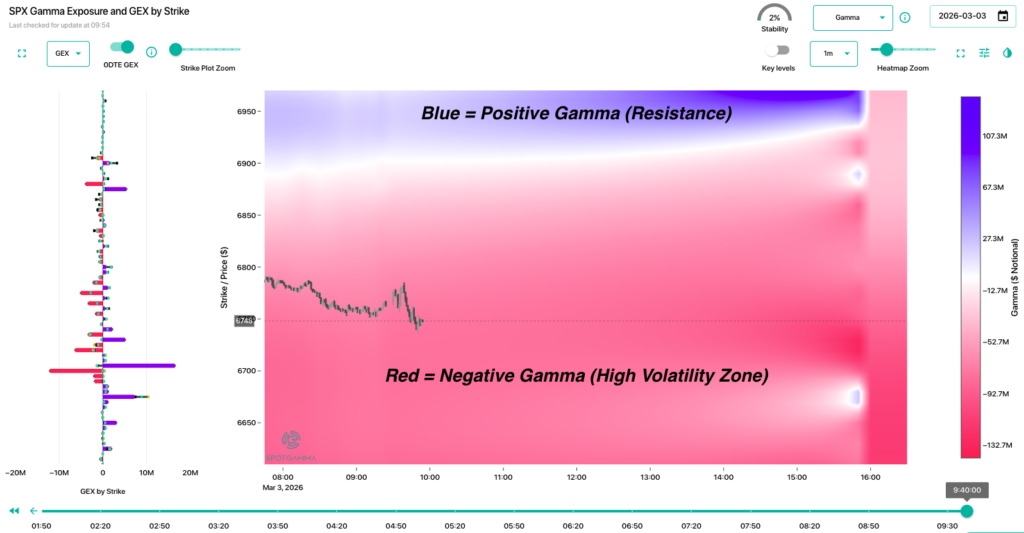
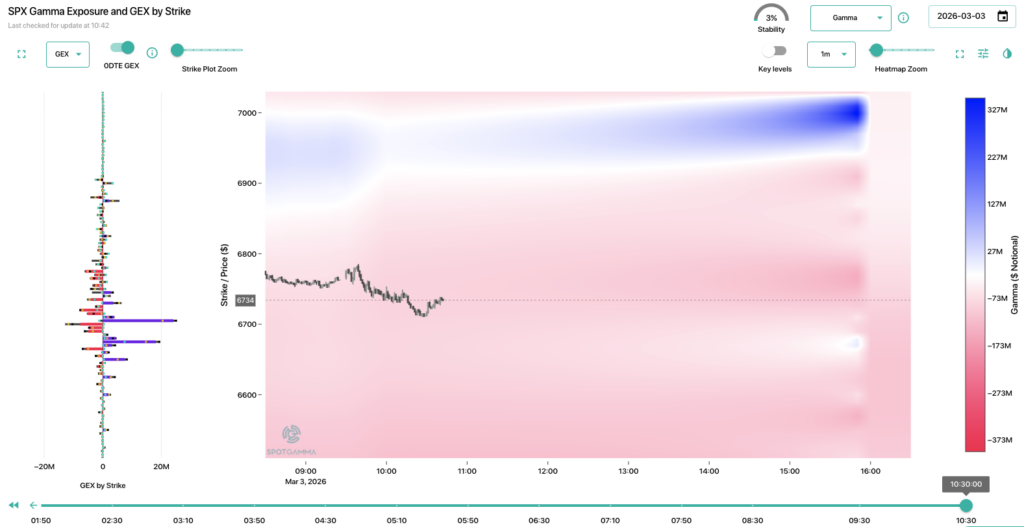
TRACE is SpotGamma’s intraday options-flow and gamma-visualization product, built on its proprietary Options Inventory Model. SpotGamma’s documentation describes one-minute updates and participant-specific views; the display is an estimate of positioning, not a direct view of audited dealer books.
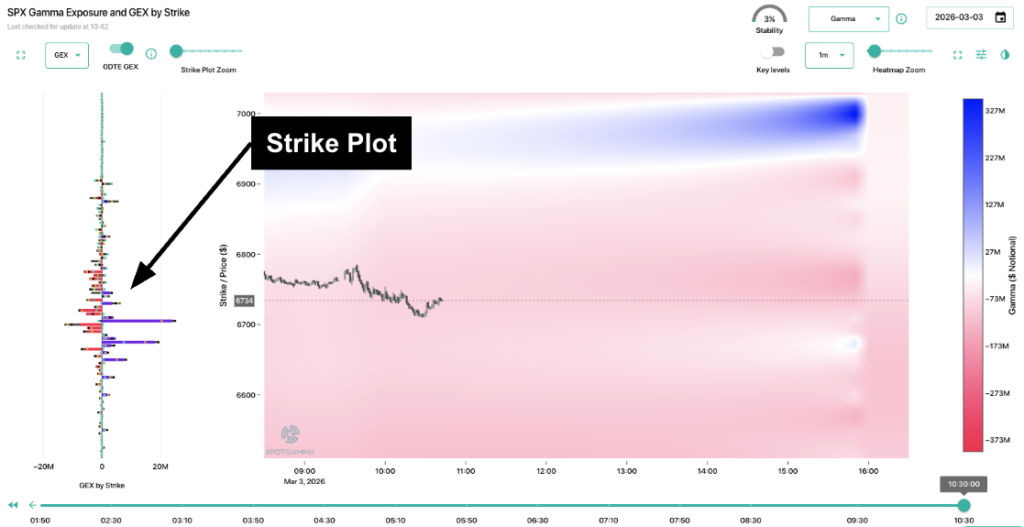
Strike Plot
The Strike Plot displays modeled GEX, open interest, and net OI by strike. Positive and negative bars describe the model’s position sign; they are not guaranteed support or resistance.
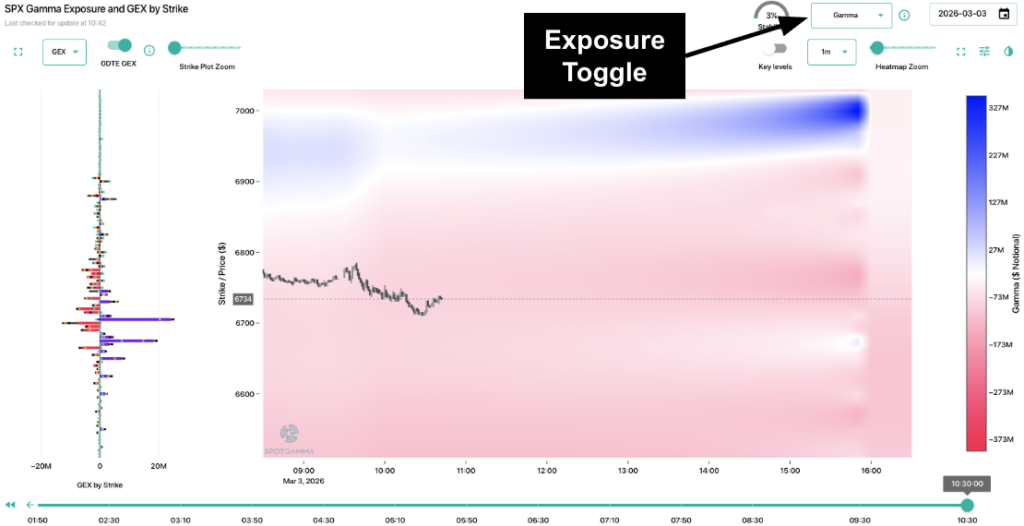
Gamma, Delta & Charm Pressure
Three models show different dimensions of dealer hedging flows — gamma (positional), delta (directional), and charm (time-decay-driven).
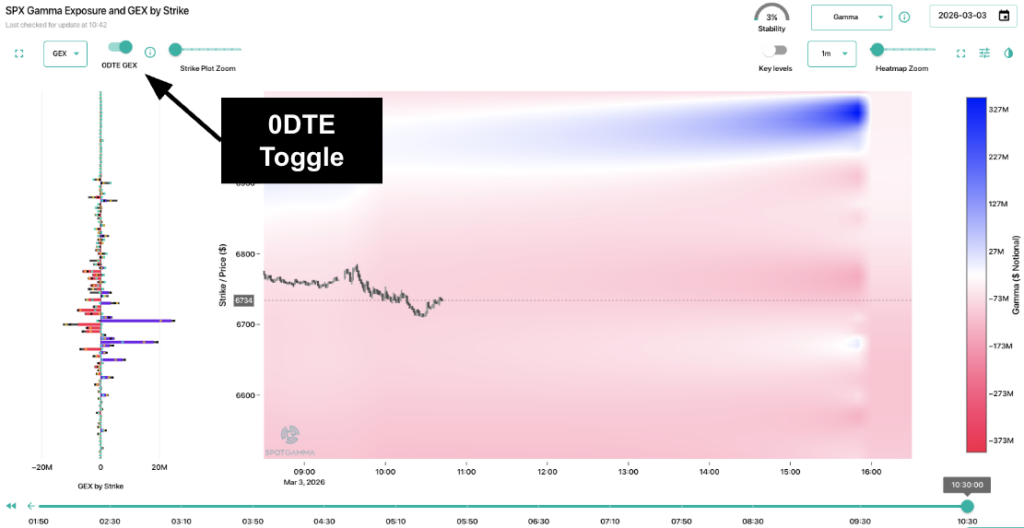
0DTE Toggle
The 0DTE view isolates modeled same-day-expiry positions so traders can compare them with the broader expiry set. It estimates which strikes may be relevant intraday rather than proving exact hedge pressure.
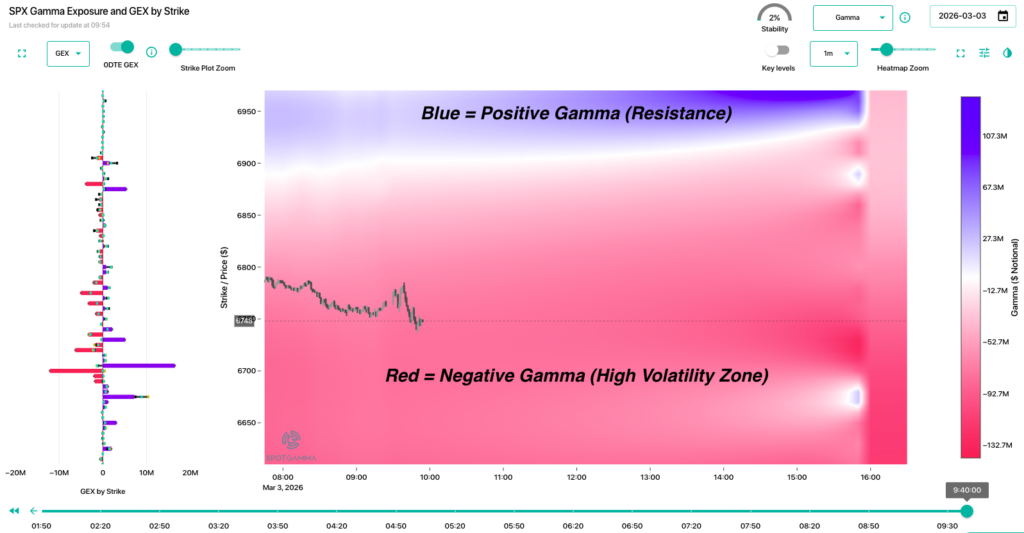
Heat Map Visualization
Color-coded heat maps visualize estimated pressure and concentration zones as they change intraday. Treat the zones as scenario references, not automatic support or resistance.
Get Access: Start Trading With the Full GEX Picture
Every SpotGamma plan includes live GEX levels, Key Levels (Call Wall, Put Wall, Volatility Trigger, Zero Gamma, Risk Pivot), TRACE, HIRO, and the daily Founder’s Note — the market’s most trusted options-structure briefing.
Essentials Membership
For active traders who want the key GEX levels and daily market structure briefing.
- Daily Founder’s Note (AM + PM)
- Key Levels: Call Wall, Put Wall, Zero Gamma, Volatility Trigger, Risk Pivot
- SPX/SPY/QQQ/IWM GEX charts
- Equity Hub — Proprietary daily GEX Gamma Exposure for +3,500 stocks
- Options Calculator
- FlowPatrol©
- Education Library
Alpha Membership (Most Popular)
For intraday traders, options, and futures traders who need the deepest, real time GEX & 0DTE data.
- Everything in Essentials +
- Full intraday, real time GEX updates via TRACE
- 0DTE Strike Plot with real-time updates
- Charm & Delta Pressure models
- Advanced Volatility Dashboard
- HIRO: real time hedging impact in +3,000 stocks
- Tape: real time options prints in +3,000 stocks
- Live daily training sessions
- Premium Discord community
- Priority support
Trusted by thousands of traders and integrated into Bloomberg Terminal • No free trial required — see plans at spotgamma.com/subscribe
Gamma Exposure FAQ
What is gamma exposure in simple terms?
Gamma exposure estimates how quickly the combined delta of modeled dealer option positions may change when the underlying price moves. It helps describe potential hedge-rebalancing pressure and volatility sensitivity.
What does GEX measure?
GEX aggregates position-signed option gamma over selected strikes and expirations. Providers may report share sensitivity per $1, dollar exposure per 1%, or another normalized unit, so the chart’s methodology matters.
How is gamma exposure calculated?
A common per-1% formula is gamma × modeled dealer position × contract multiplier × spot² × 0.01, aggregated across the included options. The inventory sign is observed only if a provider has reliable participant-side data; otherwise it is estimated.
Is GEX measured per $1 move or per 1% move?
Both conventions exist. A per-$1 figure measures delta sensitivity to a one-dollar move. Multiplying by spot and 0.01 converts that sensitivity to a 1% move; multiplying by spot again expresses the resulting underlying change as dollar notional.
What is positive versus negative dealer gamma?
Positive dealer gamma can produce counter-cyclical rebalancing—selling after rises and buying after declines. Negative dealer gamma can produce pro-cyclical rebalancing—buying after rises and selling after declines. These are conditional hedge mechanics, not guaranteed flows.
Does GEX predict market direction?
No. GEX can indicate how an initiating move might be attenuated or exacerbated if modeled dealers rebalance, but it does not identify whether the initiating move will be higher or lower.
What is the Gamma Flip or Zero Gamma level?
It is the modeled underlying price at which aggregate GEX crosses zero. The level is recalculated over hypothetical spot prices and changes with inventory assumptions, volatility, time, and included options.
What are the Call Wall and Put Wall?
They are modeled strikes with major call- or put-related concentration. Traders use them as scenario references, but neither is an automatic ceiling or floor.
Why do GEX providers publish different values?
Providers can use different position-sign assumptions, expirations, volatility inputs, spot timestamps, multipliers, intraday adjustments, and output units. GEX is a model result rather than an official exchange statistic.
Can public open interest reveal actual dealer positions?
No. Open interest shows how many contracts remain open, not which participant holds each side or whether positions are hedged elsewhere. Dealer positioning must be estimated unless participant-side data is available.
How often does GEX update?
A basic OI model updates after official overnight open interest is published. Intraday products may estimate changes from live trades. SpotGamma’s TRACE documentation describes one-minute updates, but the estimated inventory can still differ from actual dealer books.
How do 0DTE options affect gamma exposure?
Quick Answer: 0DTE (zero days to expiration) options expire the same day they are traded. They now make up about half to two-thirds of SPX options volume. On expiration day, gamma and time decay peak, so dealer hedging can pin price (positive GEX) or amplify moves (negative GEX). It is a volatility-regime map, not a forecast of direction.
Last updated: August 18, 2026. Reviewed by SpotGamma research. Volume share and dealer-hedging effects are observed through gamma exposure (GEX) and real-time hedging tools. Full methodology, limitations, and worked examples are on the Gamma Exposure (GEX) pillar.
Is GEX reliable as a standalone trading signal?
No. Use it with price, implied and realized volatility, event risk, liquidity, and live flow. A wall can fail and a negative-gamma regime can remain quiet until another force initiates a move.
What is the difference between GEX, DEX, vanna, and charm?
GEX focuses on delta change from underlying-price moves. DEX summarizes directional delta exposure. Vanna measures delta sensitivity to implied volatility, and charm measures delta change as time passes. Each describes a different potential hedge driver.
Where did the modern GEX framework originate?
SqueezeMetrics publicly released a Gamma Exposure (GEX) white paper in March 2016 and revised it in 2017. SpotGamma later developed its own positioning models, proprietary levels, and real-time products.
The Market Has a Hidden Structural Map.
You Can See It.
Options positioning is one input into S&P 500 price formation. SpotGamma provides modeled levels, context, and intraday tools to help traders evaluate that input alongside price, volatility, liquidity, and events.
Use GEX as a market-structure framework—not a prediction or a substitute for risk management.
SpotGamma GEX cluster
Use this pillar with the live tool and the adjacent guides: