SpotGamma’s Opening Setup report is a daily options-based report for SpotGamma members that highlights key changes in options pricing and positioning. Through this report, readers can gain an understanding of how buyside traders have shifted their positions over the past day and identify stocks with anomalous options pricing.
One of the report’s primary goals is to serve as a tool for trade idea generation. With that in mind, the text below demonstrates how a trader can 1) source an idea, 2) use SpotGamma tools to further explore it, and 3) structure a trade.
Identify Rich AAL Call Skew
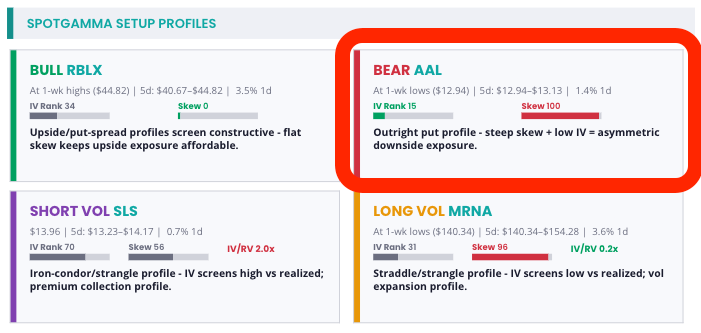
On September 9th, the Opening Setup report highlighted a high Skew Rank for American Airlines (AAL).
A Skew Rank of 100 typically denotes that 1-month, 25-delta calls are rich relative to 25-delta puts.
Examining The Skew
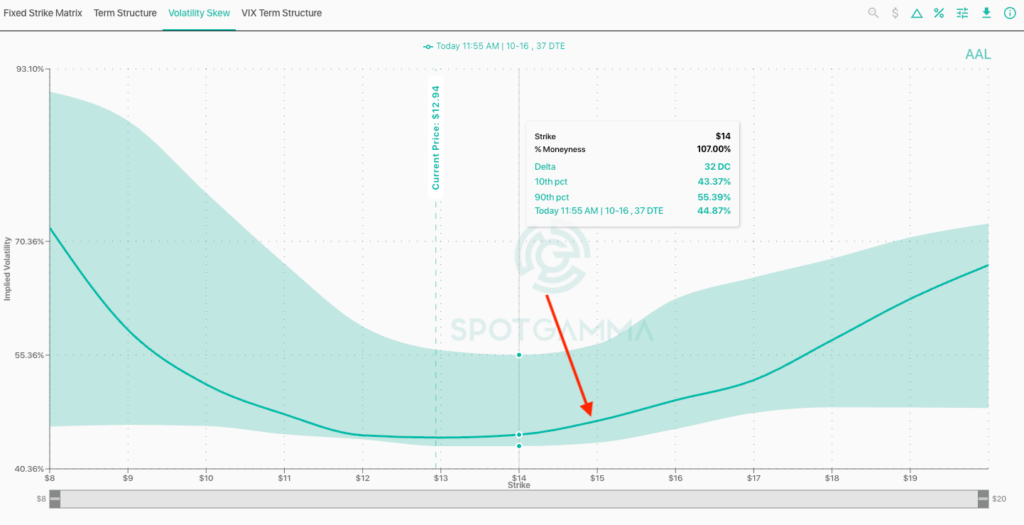
Using the SpotGamma Volatility Skew tool to analyze the October 16 option expiration, we can see that strikes above AAL’s current trading price (~$13) have an elevated Call Skew. In other words, implied volatility increases at higher strikes, signaling that traders are paying up for call options. But why?
Identifying AAL Stock Range
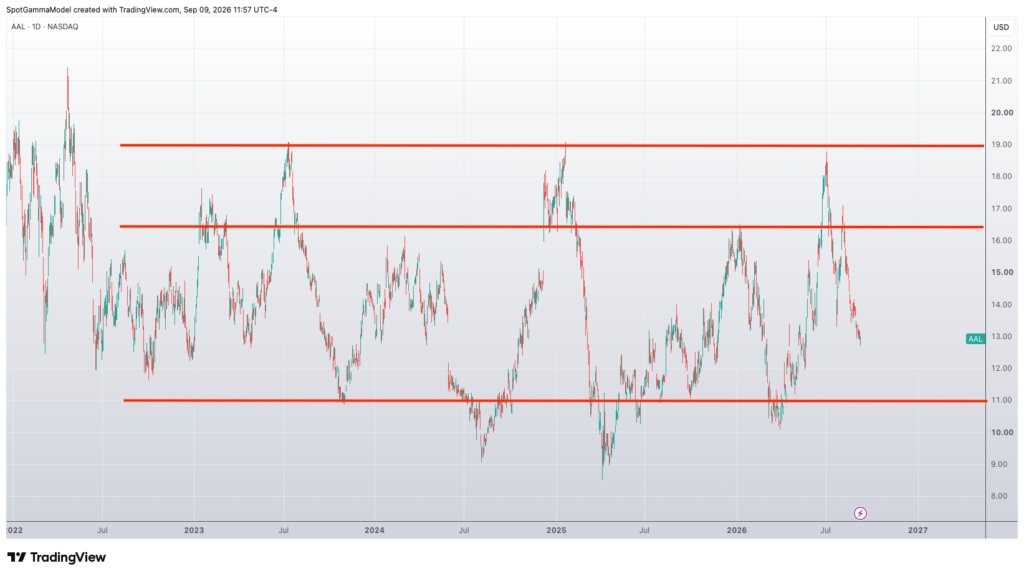
Here is a stock price chart for AAL dating back to 2023. As shown, the stock is currently in the middle of its historical range, which has consistently held between ~$11 and ~$17. The ongoing Middle East conflict continues to keep fuel prices elevated, weighing on the stock. Traders appear to be positioning in call options as a way to trade or hedge against a potential drop in oil prices and a subsequent rally in the stock.
Structuring a Trade
This positioning presents a potential opportunity to execute trades that “sell the call skew.” For example, a broken-wing call butterfly strategy would involve:
- Buying 1 near-the-money call option
- Selling 2 call options at a higher strike price
- Buying 1 call option at an even higher strike price above the short calls
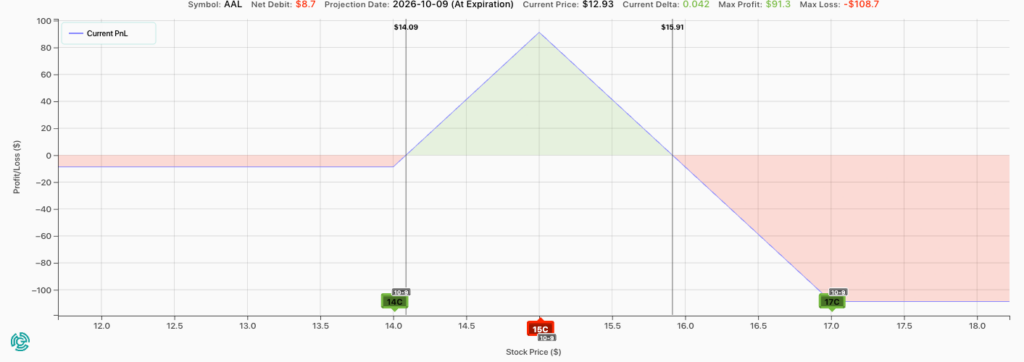
In this setup, we have chosen the 14 x 15 x 17 call butterfly structure for the 10/9/26 expiration, which is currently trading for $0.07 (7 cents).
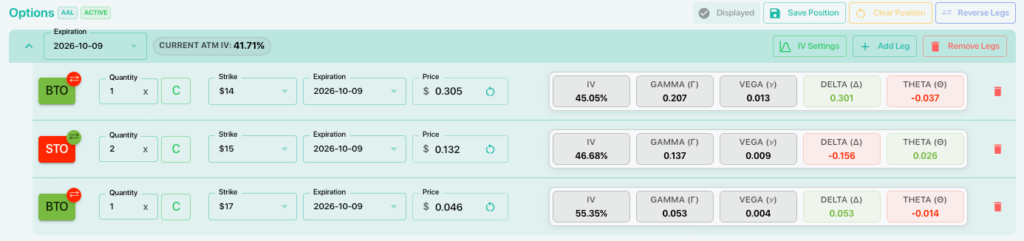
The objective of the call butterfly in this situation is to leverage the two short call options at the 15 strike to capitalize on a flattening call skew—meaning the “100 Skew Rank” shown in the Opening Setup report would begin to decline. Furthermore, selecting the 17 strike for the outer leg (creating a “broken wing” compared to a standard 16 strike call fly) structures the trade to benefit from small positive theta/carry.
Examining Trade Profit and Loss
Below is a P&L projection from SpotGamma’s calculator set to September 25—roughly halfway to expiration. As shown, the projected P&L remains positive as long as AAL holds between $13 and $15.50, with profits driven by the time decay of the short 15 strike calls (green zone).
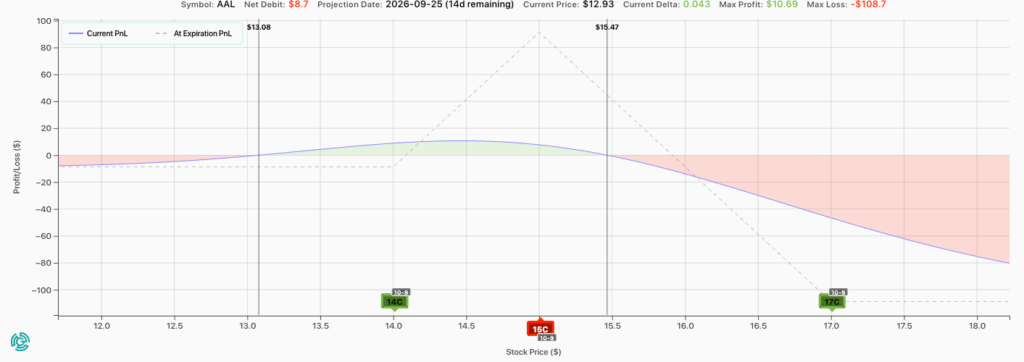
At expiration, the risk for this trade occurs if AAL closes below $14 (resulting in a loss of the $7 debit paid) or if AAL surges past $16, reaching a maximum loss of $100 at or above $17. A rally above $16 would require AAL stock to return to multi-year highs within the next 30 days (as illustrated in the chart above).