Friday’s 8:30 a.m. ET Employment Situation report has the potential to be the biggest bond-market catalyst since Jackson Hole. The key reason is that markets are currently assigning roughly a 48-50% probability of a September Fed hike, while the 10-year Treasury is sitting near 4.75% after recently testing above 4.80%. It’s important to note that Fed hike probability is down from 70% earlier this week as rates have fallen back under 4.8% following Fed Governor Christopher Waller said Thursday morning he is leaning toward no September hike if upcoming inflation data continue improving.
The best outcome for stocks probably isn’t a huge payroll beat. It’s a mildly soft report that cools Fed-hike expectations without creating recession fears.
Why this Report is Unusually Important
The labor picture entering Friday is weak enough to create genuine two-sided risk.
Wednesday’s ADP report showed only 38K private jobs versus 48K expected, the weakest pace since January. JOLTS showed 7.271 million openings, but hiring dropped from 5.332M to 5.054M, and quits declined as well. That looks increasingly like a “no hire, no fire” labor market.
There’s also meaningful revision risk. July payrolls fell 23K, while May and June were previously revised down by a combined 103K. The BLS’s recent preliminary benchmark estimate also indicated payroll employment through March may ultimately be revised down another 79K, including 178K for private payrolls. (Sources: BLS, Reuters)
What the Options Market is Pricing
This is where the setup gets interesting. We also are heading into a 3 day holiday weekend with Labor Day observed in the US next Monday. That is a tailwind for stocks as VIX tends to have a natural heaviness due to theta decay ahead of long weekends. Who wants to pay that theta tax when markets are closed for an extra day?
Despite all the bond volatility, the VIX is now back under 15, meaning equity options aren’t pricing anything resembling a panic event.
Based on pricing midday Thursday, a current short-dated options snapshot has:
SPY — Friday expiration
- Spot: ~$773.00
- Expected move: ± $4.95 / ± 0.64%
- Implied range: $768 – $778
- Friday IV: ~14.1%
- Next Tuesday IV: ~9.3%
QQQ — Friday expiration
- Spot: ~$717.50
- Expected move: ±$6.46 / ±0.90%
- Implied range: $711 – $724
- Friday IV: ~19.9%
- Next Tuesday IV: ~13.5%
That’s useful information from the options markets. Options are clearly charging an event premium for Friday, but the market only expects roughly a 0.6% SPY move and 0.9% QQQ move through expiration. This is LOWER than the move that has transpired so far on Thursday as both SPY and QQQ surged higher over 1%.
In other words, options traders expect volatility, but not a major macro shock. That creates opportunity if Friday’s number materially changes Fed expectations.
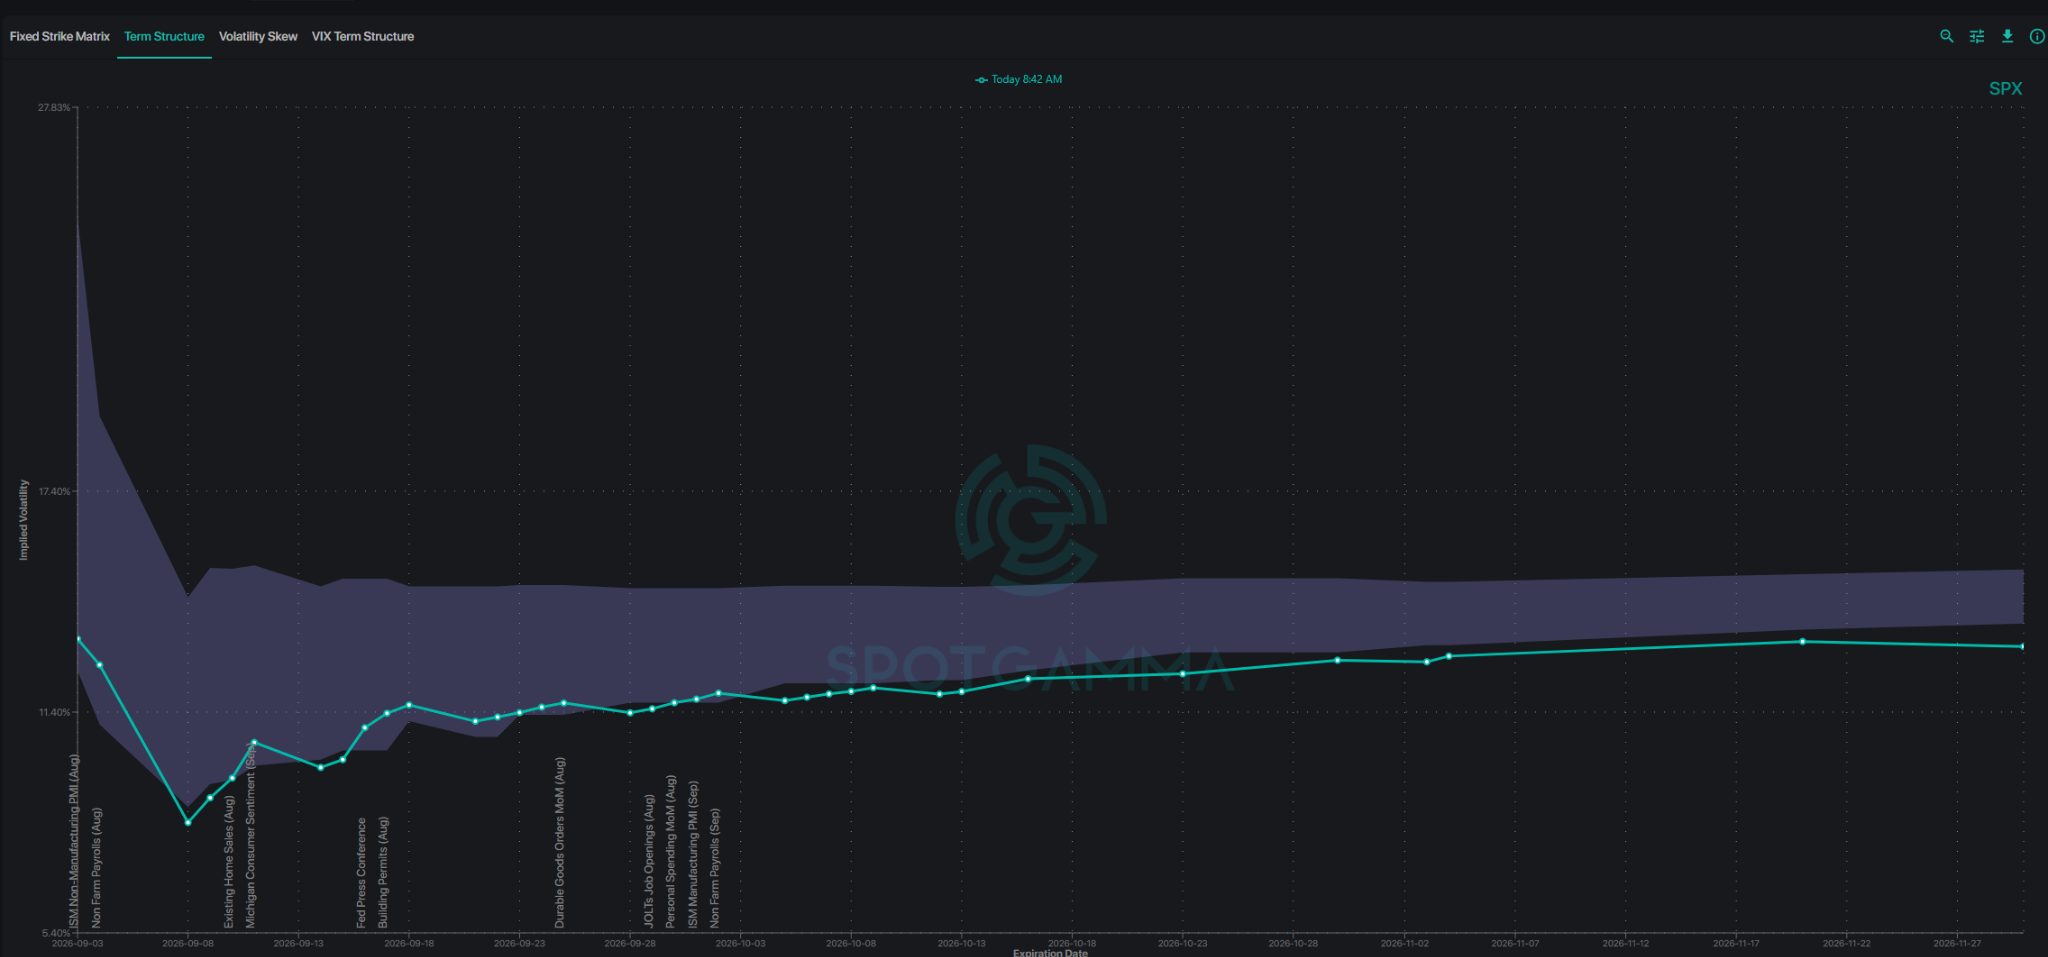
The SpotGamma graph below shows the SPX term structure as Friday’s IV is highest on the curve for September, and then stays under 11% daily IV until the mid-month FOMC meeting. The shaded area shows the recent 90 day average range actually higher than current implied volatility. Even going out to October and November where midterm election volatility seems underpriced.
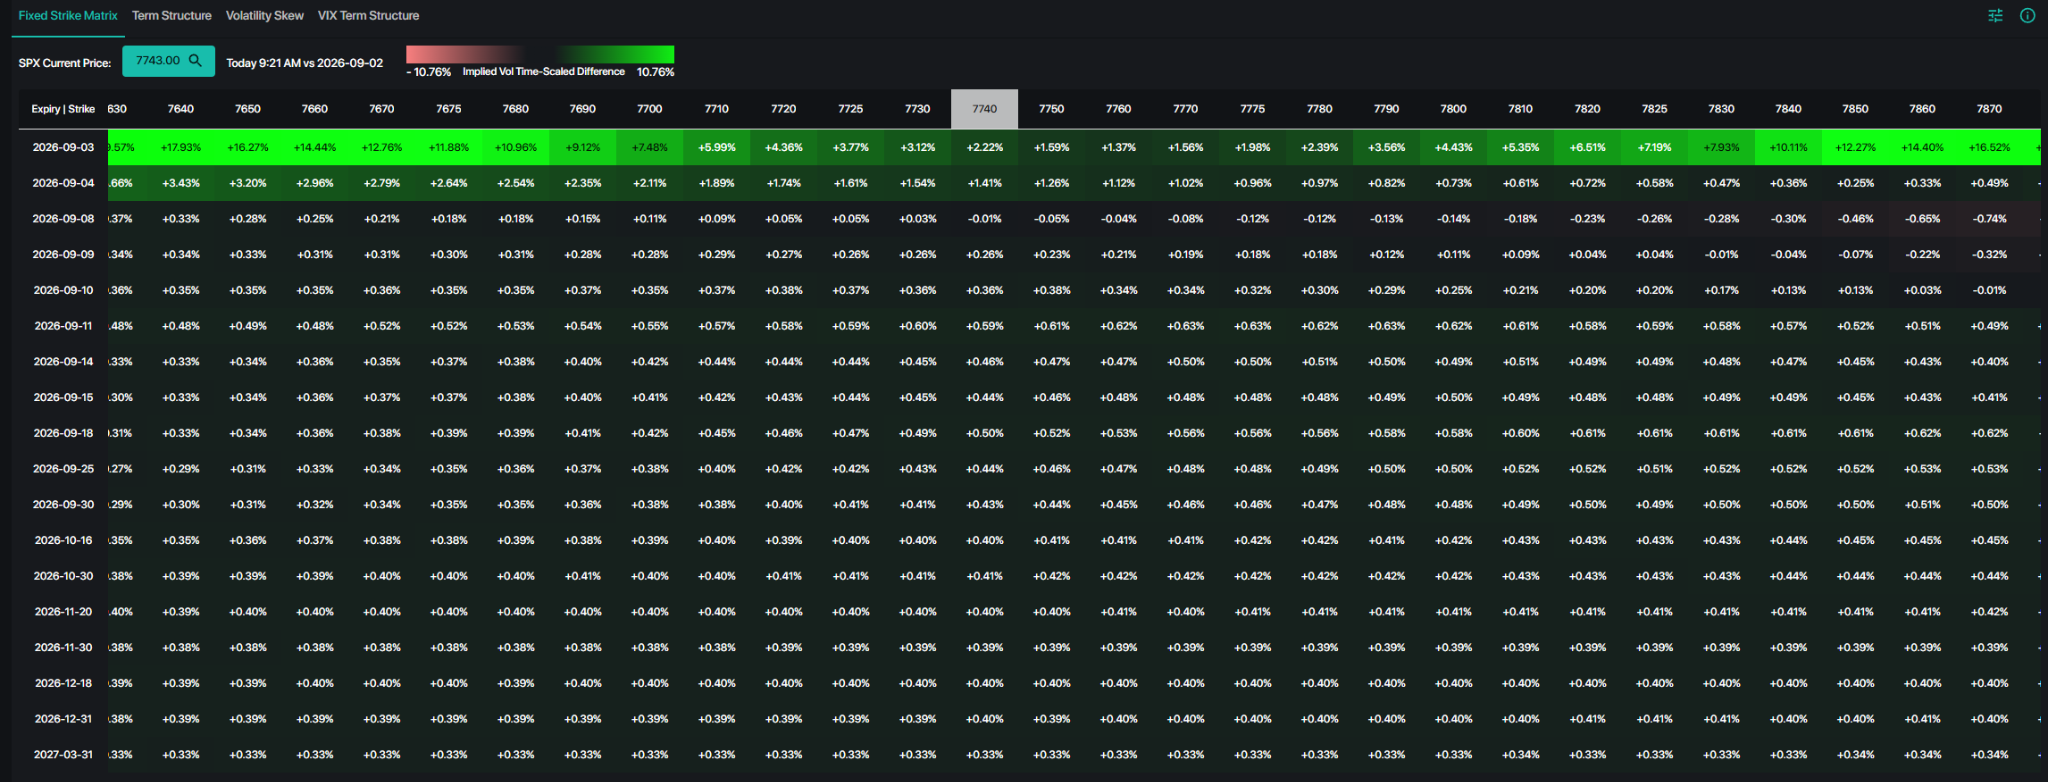
Another interesting angle today is SPX fixed strike implied volatilities rising in most expirations, especially the Friday 9/4 expiration. The SpotGamma Fixed Strike Matrix shows a swath of lightly green shaded strikes as markets zoom higher the day prior to payrolls. This may also have something to do with the rush back into Mag7 related names that are leading the advance Thursday. If fixed strike vol’s subside later today and into Friday as most likely is the case then that provides an additional tailwind for stocks into the long weekend.
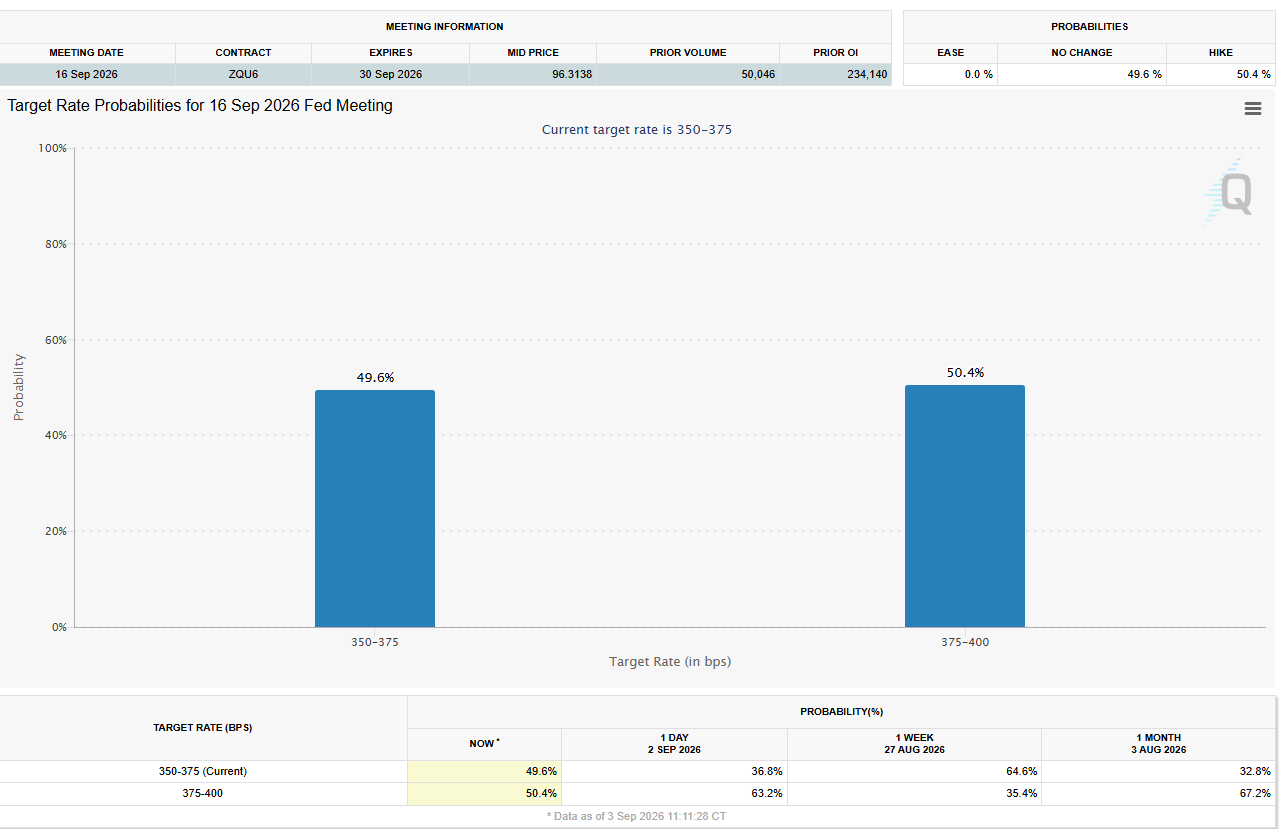
The Fed Watch Tool from the CME shows a clear change since earlier in the week with respect to a September rate hike. The odds have now crossed below 50% after being near 70% a few days prior. The dovish language from Waller this morning surely can provide wings for doves to fly into the Fall as September begins. But as we know, the Fed rate odds are fickle numbers that shift with the wind and so Friday’s jobs data is crucial to see for this market move to sustain.
With assets like gold and Bitcoin also seeing strong rallies off the recent lows it argues for the debasement trade being in play into year end if that Fed outlook is more dovish from here ahead of the key midterm elections now just two months away. With the administration saying that bond markets will be defended it likely provides a ceiling for rates at this point. Other assets like metals and crypto clearly are liking the prospects of a looser Fed.
What Does Dealer Gamma Suggest?
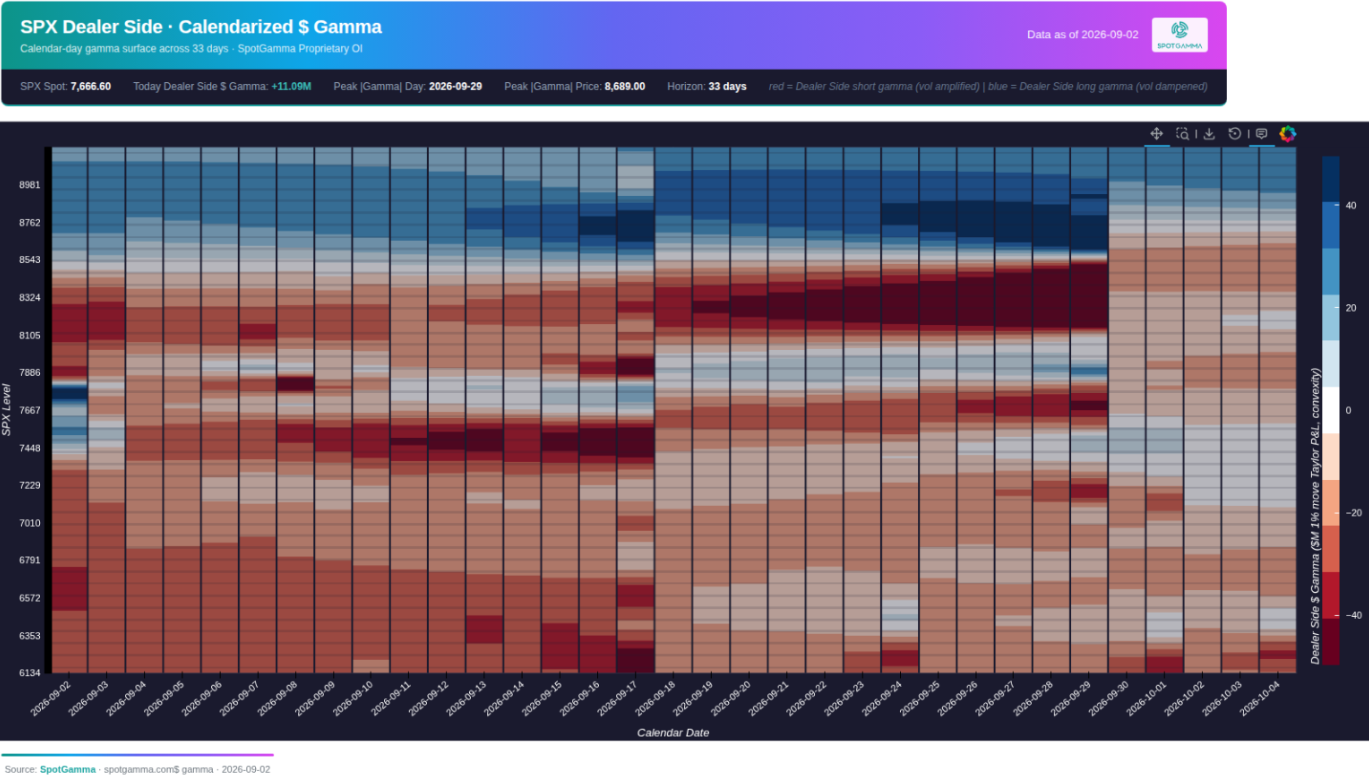
Adding more color literally here is the SpotGamma calendarized gamma map which shows SPX options and dealer gamma exposure. The red shaded band in the middle of the map below current prices is more dominant in expirations beyond this week and so potential risk to the downside if price breaks under 7650 heading into the next few weeks. But Friday’s expiration for the jobs report is mostly mixed, but less blue from the prior few days this week when markets were more so pinned near the blue tinted area of positive gamma. Also notable is the deeper dark red color above 8000 into late September. If stocks did breakout higher after FOMC mid month then it could propel a gamma squeeze of sorts into the quarter end.
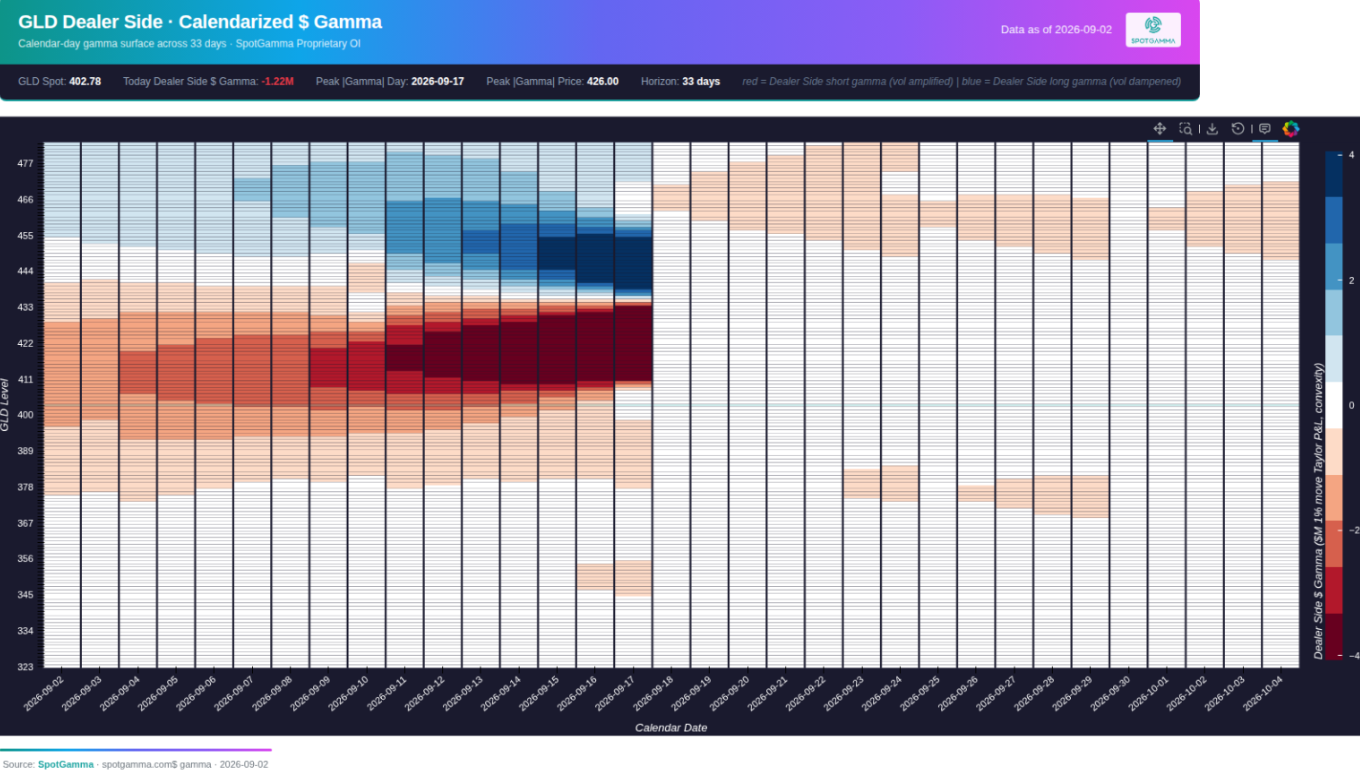
The next gamma map below is for GLD which is the gold ETF. The clear takeaway here is the negative gamma for expirations through September monthly OPEX of 9/18. A move higher from the recent retracement could see acceleration above 410. This is where gamma grows negative for dealers and may force buying into 435 where gamma becomes more positive based on the blue shaded area.
Potential Scenarios Following the Jobs Report
Scenario 1: Goldilocks Jobs Report — BEST for stocks
Something like:
- Payrolls: +20K to +60K
- Unemployment: 4.1%
- Wages: +0.2–0.3%
This would confirm cooling employment without signaling a collapse.
The resulting moves in markets would then likely be stocks up, dollar down, yields down, and thus a September rate hike probability lower.
While most stocks likely would rally on this news, the Russell may do so in a bigger way because small caps have suffered the most from the hawkish Fed/rates repricing. IWM call spreads as a result would be enticing.
Scenario 2: Hot Jobs — Most Straightforward Bearish Outcome
Something like:
- Payrolls: >100K
- Unemployment: 4.0–4.1%
- Wages: ≥0.3–0.4%
This is the scenario we would worry about most.
The Fed already believes inflation is too high. The ISM Manufacturing Prices index was 71.1, and oil remains around the mid-$90s Brent area because of the Iran conflict.
A strong labor report removes one of the biggest arguments against a September hike.
The resulting moves in markets here would then likely be yields sharply higher, 10 year over 4.8% which has been a crucial level, dollar higher and stocks lower as the Sept rate hike odds would almost surely ramp above 75% probability.
In this bearish scenario, IWM put spreads are compelling because small caps have shown considerable sensitivity to rising financing costs.
Scenario 3: Very Weak Jobs
Lets suppose another scenario came about where jobs were weaker than preferred to the point where economic strength is questioned.
- Payrolls ≤0
- Unemployment ≥4.2%
- Wages ≤0.2%
The first move would probably be:
- Treasuries ↑ / yields ↓
- Fed-hike probability ↓ sharply
- QQQ ↑
But don’t automatically assume weak jobs = bullish stocks.
The second question becomes:
Is this benign Fed relief or recession risk?
If payrolls are negative, unemployment jumps to 4.3%, household employment collapses and previous months are revised down heavily, the market could shift from:
“Great, no Fed hike.”
to:
“Something is wrong with the economy.”
The Sneaky Bearish Result Might be Weak Jobs + Hot Wages
For example:
- Payrolls +10K
- Unemployment 4.2%
- Wages +0.4%
That is arguably worse for markets than a simple payroll beat.
Labor demand weakening + wage inflation remaining sticky or a quasi-stagflationary signal. This is the death nail for stocks and bonds together that could spur a volatility regime shift into September, but also the scenario that is much less probable.
Bottom Line
The options market is currently pricing a meaningful but relatively contained Friday move, while the bond market looks considerably more nervous than equity volatility does. That’s the asymmetry we find most interesting.
With the VIX around 15 and SPY pricing only about ±0.6% through Friday, a payroll report that genuinely moves September Fed expectations could produce a larger realized move than equity options currently imply.
For trading purposes, I would make 4.80% on the 10-year, ~$768/$778 on SPY, and ~$711/$724 on QQQ the main dashboard levels to monitor Friday morning rather than trying to predict the exact NFP print result.