Oracle reports fiscal Q1 2027 results Thursday, September 10, after the close, with its call at 5:00 p.m. ET. The report is less about the headline EPS beat and more about whether Oracle can convert its enormous AI backlog into profitable cloud revenue without further stressing cash flow and financing.
Options Market Pricing Expectations
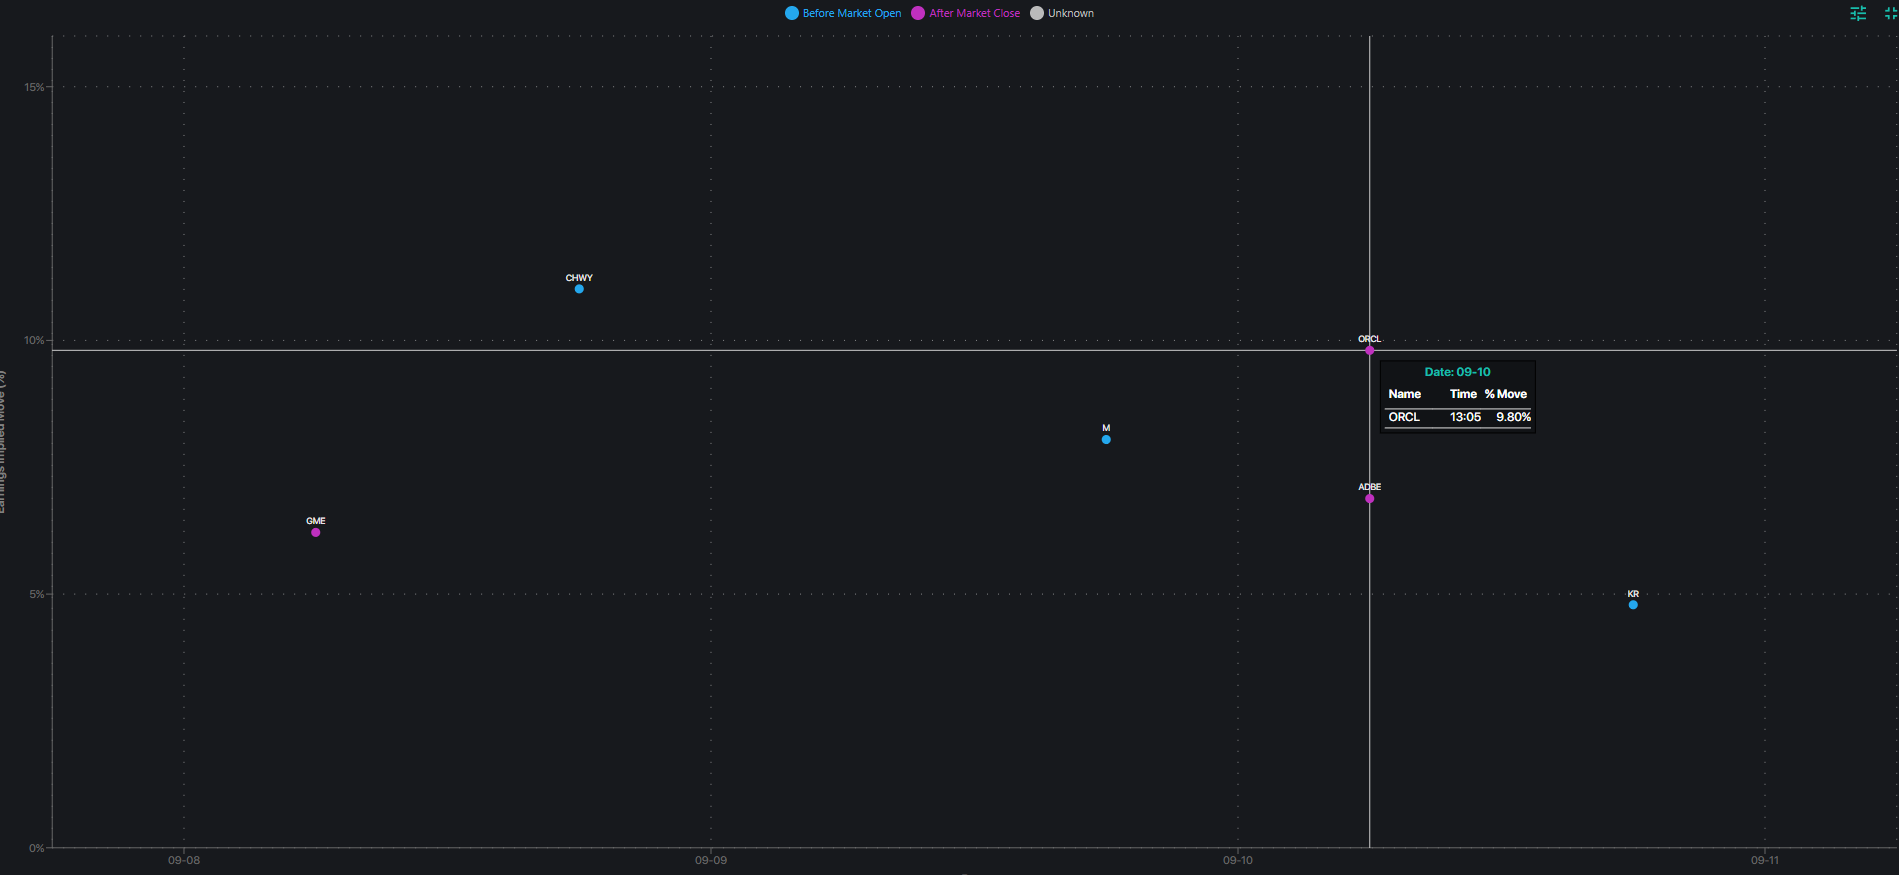
ORCL options are expensive but not obviously overpriced because the stock’s earnings-move distribution has become extremely fat-tailed over the past few years. In a normal, textbook statistical distribution (a bell curve), big moves are supposed to be rare. The “tails” of the curve (the extreme outcomes) are thin. A “fat-tailed” distribution means the extreme outcomes, huge stock jumps, way bigger than a bell curve would predict, happen more often than they “should.” For ORCL specifically, this means that in recent years, when the stock has had a big earnings reaction, it’s tended to be a really big one — not just a typical 3-5% move, sometimes delivering double-digit swings.
For options expiring on September 11, the first expiration following earnings, the market continues to price an unusually large move. Using the liquid weekly options, the market is implying a move of approximately 11.5% through Friday’s expiration. The IV rank is at 67% for the stock, which says that options volatility has been priced lower than it currently is for 67% of the past year.
The Trading Hurdle
A long September 11 straddle purchased near $19.25 needs Oracle to finish below approximately $145.75 or above $184.25 to reach expiration profitability. A large overnight move may still fail to produce a profit if it remains inside those levels and implied volatility collapses.
Premium sellers have the opposite advantage: exceptionally high IV and more than $300 of estimated daily straddle decay. But they are accepting two major risks:
- Oracle has produced several extreme earnings reactions that exceeded the implied move. Most notably the September 2025 earnings report exactly one year ago that produced a 40% surge in the stock overnight.
- August CPI to be released Friday at 8:30 a.m. ET—before the stock and options market reopen.
Because Oracle reports Thursday evening and CPI arrives before Friday’s opening bell, the September 11 options contain both company-specific earnings risk and macroeconomic inflation risk. Traders cannot close the position between those two events during regular options-market hours.
ORCL’s average one-day move over the past eight quarters is only about 5.1%, well below the current 11.5% pricing. But its two-year average intraday peak earnings move is approximately 16.8%, distorted by several huge moves, including the September 2025 outlier. Over a longer decade, the average peak move is closer to 10%.
What Does Dealer Gamma Say?
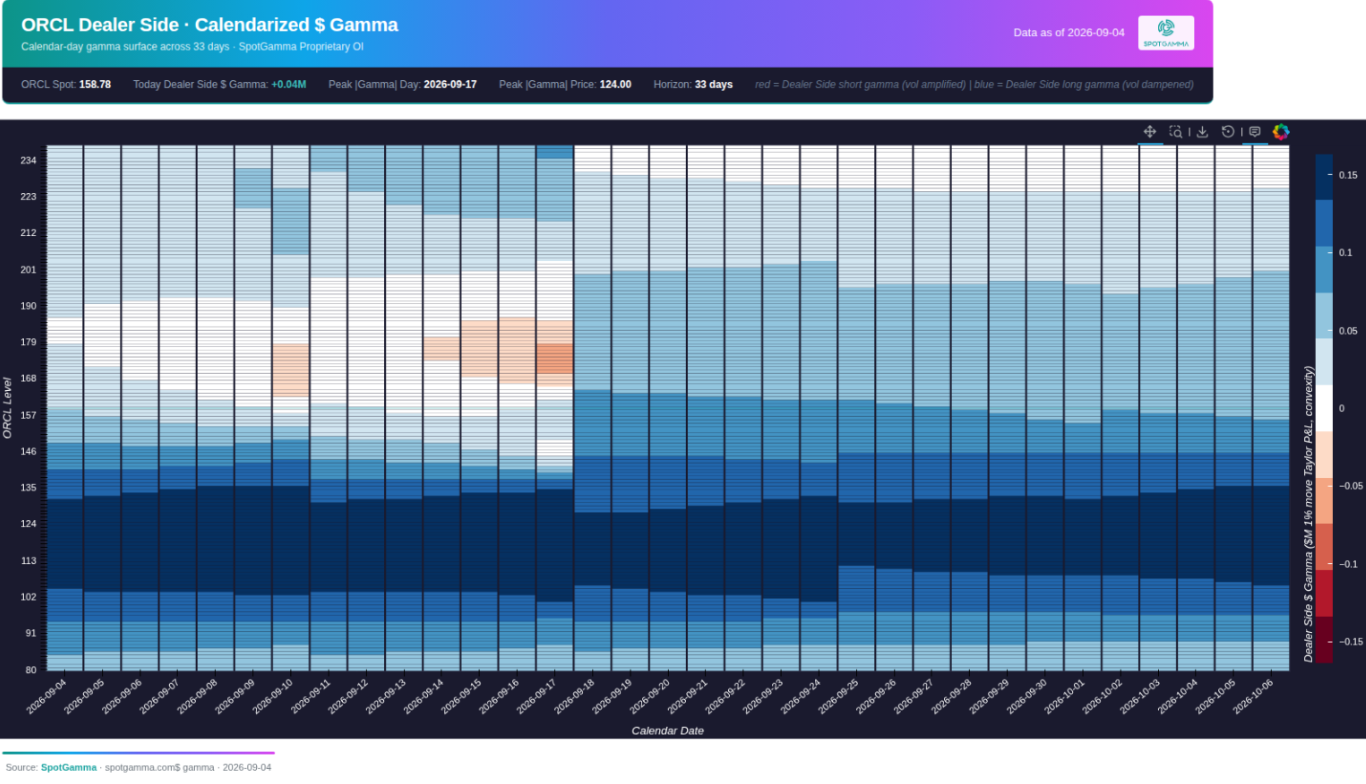
Dealers appear to be leaning to positive gamma below current prices for most expirations into the next month. The blue shaded color on the SpotGamma calendarized gamma map above shows strikes below 150 exhibiting positive gamma with the darkest of blue under 135. This would imply price support if tested following earnings potentially due to dealer exposure flattening out. This tells us that any downside reaction after the report may see buyers step up and result in a rebound. The slight red tint to the map above current prices shows minor negative gamma above 170 for September OPEX. This happens to be the level which it faded from Tuesday morning right into the 200 day moving average.
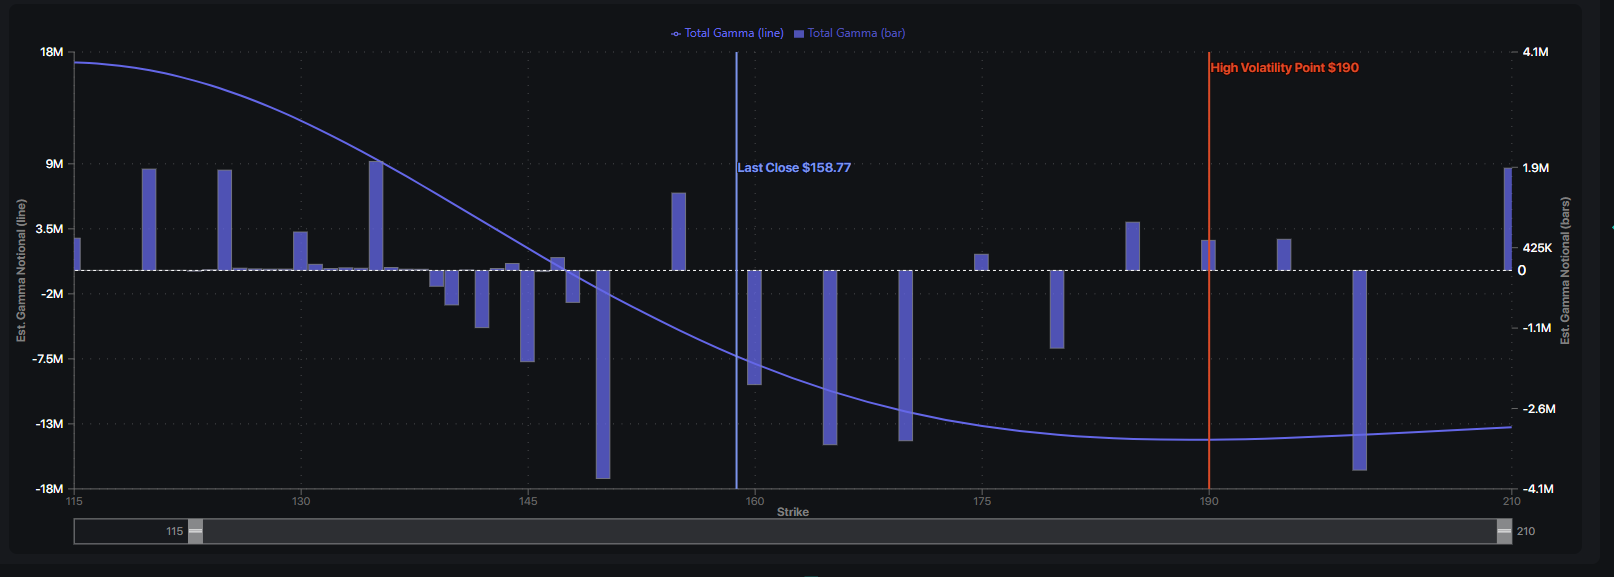
The SpotGamma Equity Hub Synthetic OI model above shows the gamma line flipping to positive right near the 147 level. This would imply further support below here. The standout gamma exposure above shows clear negative gamma bars at 160-170. Prices are freely able to move quickly through this range. We would suspect any upside advance above 170 would catch resistance near 185-190 where its next swath of positive gamma exposure lies. Coincidentally, that lines up technically on its volume profile chart with the one year AVWAP being at 190.
Volatility Skew in the Options Market
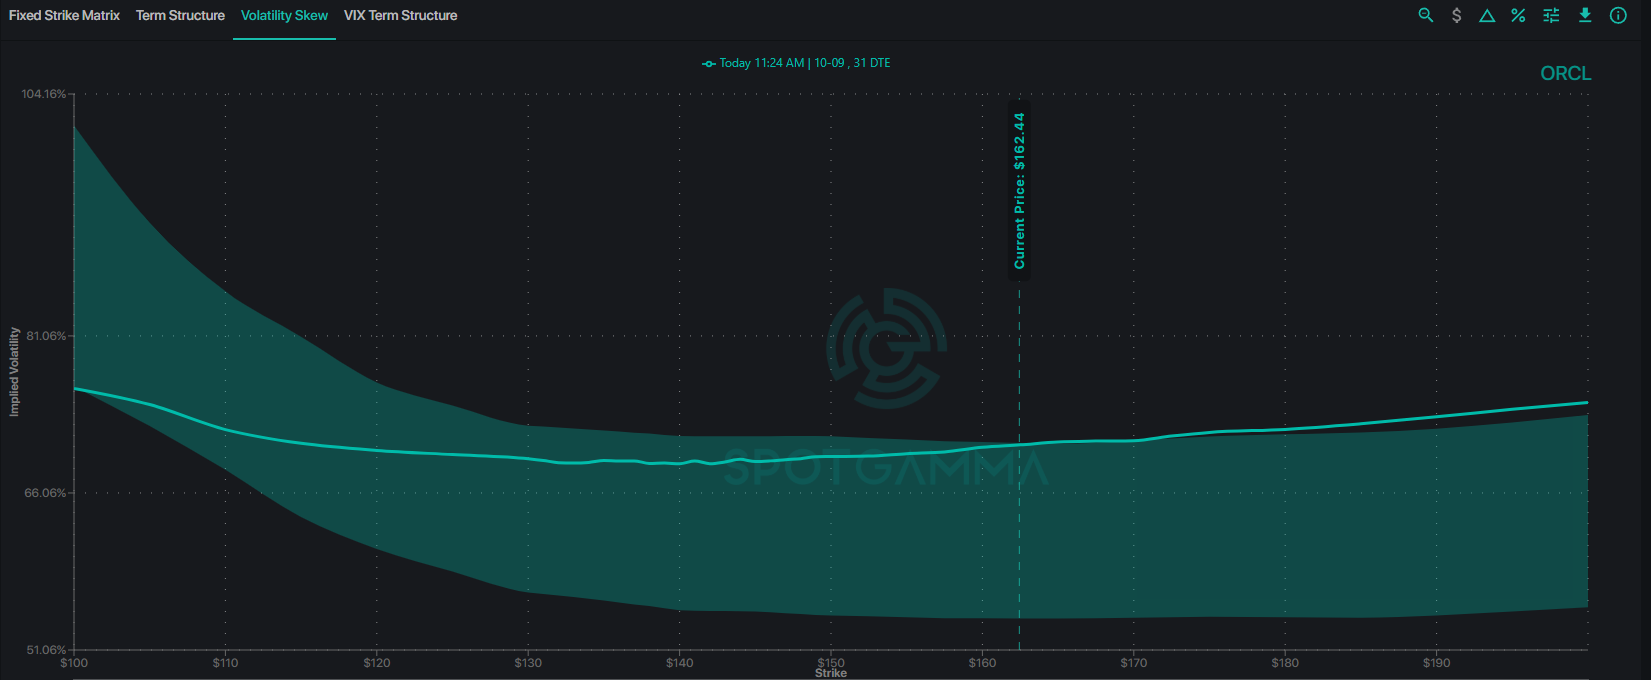
We can see there is a clear call skew in ORCL options. The nearest 30 DTE options cycle shows a lift in implied volatility for OTM calls above 170. These skew levels are above the past 90 day average which is depicted in the green shaded range. This sort of look in the volatility skew points to market pricing in the risk of an outlier being higher. This is commonly the case in AI focused Technology stocks. The condition creates opportunity to buy vertical call spreads at a synthetically cheaper total debit, since the OTM call that is sold in the spread will be at a much higher IV relative to the call that is bought.
Fundamentals
Oracle’s previous quarter was fundamentally strong: revenue reached $19.2 billion, cloud revenue $9.9 billion, OCI revenue $5.8 billion, and RPO $638 billion. But FY26 capital investment produced negative $23.7 billion of free cash flow, which explains why the stock now responds as much to margins, capex and financing as to cloud growth. (Source: Oracle Investor Relations)
The most important commentary will be:
- How quickly the $638 billion backlog converts into recognized revenue.
- OCI gross margins and utilization of recently built data centers.
- FY27 capex and whether the planned $40 billion financing requirement changes.
- The amount of customer-prepaid or customer-supplied GPUs.
- Concentration among major AI customers, particularly OpenAI-related demand.
- Multicloud database, Fusion, NetSuite and Oracle Health growth. Strong OCI alone is not necessarily a clean bullish signal for the broader software sector.
Software-sector Implications
Oracle is approximately 5.8% of the IGV software ETF. So an 11.5% ORCL move mechanically contributes around 0.7 percentage point to IGV before any sympathy moves.
The read-through will likely split into three groups:
- Enterprise software/data: CRM, NOW, SNOW, ADBE, MDB and DDOG. These benefit if Oracle shows that AI is increasing database usage, application adoption and enterprise cloud consumption—not merely infrastructure spending.
- Hyperscalers: MSFT, AMZN and GOOGL. Strong OCI growth validates cloud demand but also highlights Oracle’s growing competitive position.
- AI infrastructure: NVDA, AMD, AVGO, ANET, DELL, HPE, VRT and CRWV. Higher Oracle capex and data-center expansion are positive demand signals for suppliers, even if Oracle itself falls on cash-flow concerns.
A particularly plausible mixed outcome is: strong OCI demand and capex lift infrastructure suppliers, while ORCL declines because margins, debt or free cash flow disappoint. That would not necessarily be bearish for the entire technology complex.
Analyst Sentiment
Looking at Koyfin estimates, Wall Street analysts are bullish on the stock with 28 Buy ratings, 8 Strong Buys and 7 Holds. The average 12 month analyst price target is currently $242 which implies a move of nearly 50% from today’s price. (Source: Koyfin)
Jefferies is bullish with a $290 target and likes the share setup into the company’s fiscal Q1 report, even though it is a seasonally soft quarter. Oracle investor sentiment is “near peak-negative” and most of the bad news is priced in. Jefferies believes a cloud growth inflection and an uptick in software-as-a-service could dispel some of the bear thesis. Citi added an upside 90-day catalyst watch on Oracle while keeping a Buy rating on the shares with a $330 price target. The stock has seen one of the most extreme dislocations in its history due to investor capitulation and technical selling factors. Citi believes robust AI demand trends can drive positive estimate revisions and the stock higher. It sees a buying opportunity at current share levels. (Source: Fly on the Wall)
Setup to Watch: Post Earnings Reaction Trade
Best overall approach
Unless you have a strong informational edge on Oracle’s cloud results, we favor waiting until after both earnings and CPI. Let the initial IV crush occur, then trade the confirmed direction using a 30–45 DTE debit spread.
If bullish ahead of earnings
Consider defined risk broken wing call butterfly spreads targeting upside into the 190 region. For example, on Tuesday late in the trading session, the September $170/$190/$200 broken wing call fly was available at a $3.30 debit. That is the max risk on the trade and has zero risk to the upside since the fly is a broken wing variation of a butterfly. The sweet spot would be settling into 190 after the earnings event vol crush passes and expiration approaches.
The bullish thesis requires more than an EPS beat: OCI/cloud growth near or above the guidance ceiling, continued RPO growth, FY27 guidance intact or higher, and reassuring cash-flow commentary.
If selling volatility
Only consider a defined-risk structure, such as a $135/$140/$180/$185 iron condor. And only if Thursday’s credit is at least roughly one-third of the $5 wing width.
We would not favor this setup personally. The 11.5% implied move looks rich relative to the ordinary eight-quarter close-to-close average, but ORCL has repeatedly produced extreme tail moves—and CPI this week adds a second catalyst before expiration.
Putting it all together
Because ORCL has had a habit of making unusually large moves around earnings lately, option traders are pricing in the possibility of another huge move. This makes the options cost more. So while the sticker price of the options looks high, it’s not necessarily a mispricing or a rip-off — it may just be a rational response to the stock’s recent track record of occasionally moving way more than normal volatility math would suggest.
Our cleanest takeaway is to treat Oracle as an AI-capex and cloud-economics test, not simply a traditional software earnings report. The options market demands approximately an 11.5% move from a long straddle buyer, yet Oracle’s recent history makes selling that premium without defined risk unusually dangerous.
Estimated reading time: 9 minutes