My view of the past week has been this: The markets slipped into negative gamma on Monday 2/24 under the narrative of Coronavirus fears. As large concentrations of puts went in the money their hedging requirements increased, meaning gamma got more negative as the market moved lower. Once in negative gamma territory options dealers change their hedging style from trading against the market, to trading with the market. Trading with the market (hedging negative gamma) has the effect of expanding price movement – aka volatility.
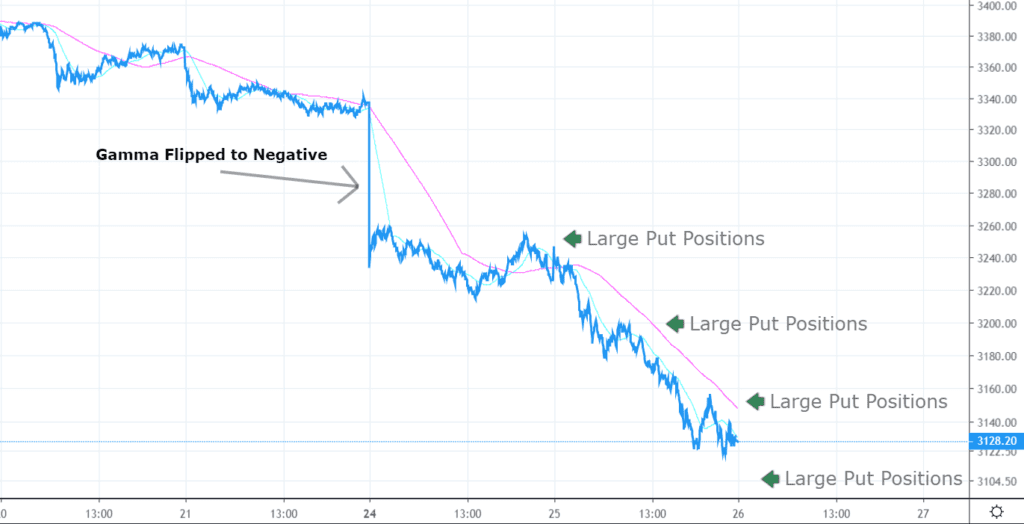
As the selloff deepened, negative gamma increased meaning dealers were hedging with ES futures in larger size. As volatility increases futures markets thin out. The available bid/off size widens out, causing greater price movement. For example, during calm markets if you could typically trade 100 contracts through 2 ticks of the bid, you know need to go 7 ticks through the bid. As dealers need to be aggressive when hedging they will push prices farther in order to get the liquidity then need. In my opinion this is why we had so many moves up and down of 50-100 handles in the SPX.
Heisenberg always has the latest from McElligott (below). Also the WSJ had a “gamma” article too.
Via Charlie McElligott
- Two “left tail” macro-catalysts surged into last week (Coronavirus “black swan” and the stunning ascent of Bernie Sanders as “candidate #1” acting as a clustered “negative growth shock” impulse) hit at the perfectly wrong time into US Equities- and US Rates– markets
- Into options expiries for both US Equities and USTs / Rates late last week, we had seen Dealers extraordinarily “Long Gamma” in each of these “ultimate” asset-classes thanks to recently placid “financial conditions” thanks to Fed “policy asymmetry” and a relatively “Goldilocks” US Economy which incentivized “vol selling” behavior from investors looking for “yield enhancement” / “income generation”—helping in-turn drive S&P and Nasdaq to hit their all-time highs just last Wednesday
- This (now ancient) Dealer “Long Gamma” choke-hold over prior months had acted as an insulating / vol suppressing flow that buffered against shock-moves and, generally speaking, had kept us in relatively tight directional “bands” (as Dealers short options need to “buy dips or “sell weakness,” especially as we neared expiry)
- However and following the large expiries late last wk (VIX last Weds, everything-else last Fri), these two “macro shock catalysts” created a profoundly negative price impulse which sent “spot” levels in Equities Index, Equities Vol and Rates deeply through prior ranges, which drove Dealers into “Short Gamma” territory—meaning that instead of insulating market moves as they had been previously, that now Dealer hedging flows would see them pressing into the directional moves (in this case, shorting into the new lows in Equities index, or buying VIX- and USTs- / STIRS- the more they “rallied”)
- And as [I’ve] stated for nearly a decade—in a market structure which is now built on “negative convexity” / “short vol” / “short gamma” strategies in order to generate “yield,” as you’ve been incentivized by the global central bank “put,” financial repression” and their complete submission to “financial conditions” (the politically correct form of saying that Central Banks are beholden to markets and the “wealth affect”), any spikes in volatility are to be “sold” and dips in equities are to be “bot,” while said vol / term premia suppression policies (rate cuts, large scale asset purchases, liquidity injections) too “green light” carry- and momentum- trades, especially with the cheap cost of leverage
- The problem is, the more something “trends” the more leverage you need to apply to maintain target exposures—which is the working definition of “stability breeding instability”
- So on that macro catalyst “shock down” which forced Dealers into “Short Gamma” territory then exacerbating the moves further at the “extremes” (selling lows in Equities to remain hedged, or buying Vol / USTs / ED$ at highs), we then exposed the MECHANICAL DELEVERAGING FLOWS of systematic “vol control” / “target volatility” universe which now need to gross-down—because VOLATILITY IS THE EXPOSURE “TOGGLE”