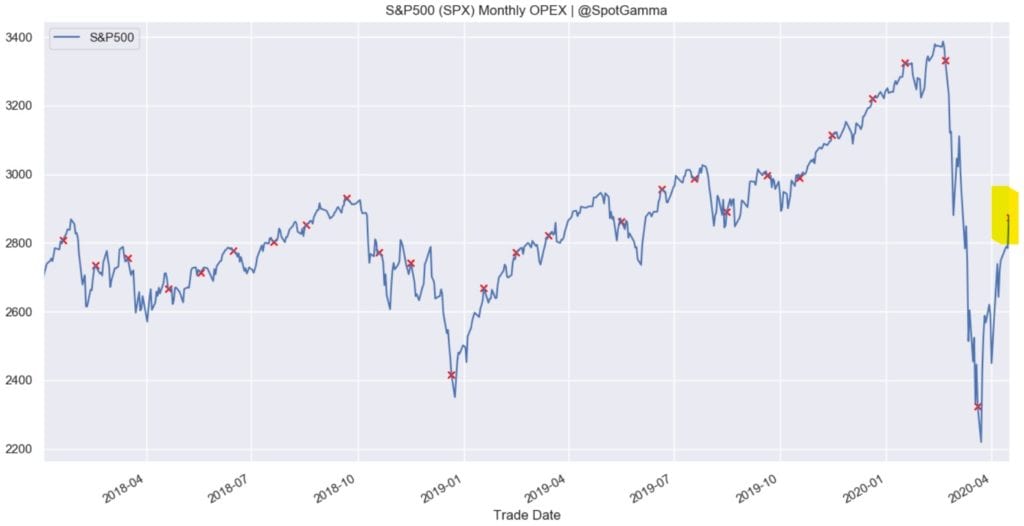
We wrote about why we think SPX Options Expiration can create volatility before (see here) and wanted to post the chart below which shows just how impactful the large monthly SPX options expiration has been the last 2 months. You can see in the chart below the February expiration was within 2 days of the high, and the March expiration within one day of the low. Notably in January options expiration was also a turning point.

Aprils expiration was this past Friday (4/17/20) and comes after a massive ~25% rally off of March expiration. We cant profess to know if the market turns when trading opens tomorrow, but that would align with many previous expirations.
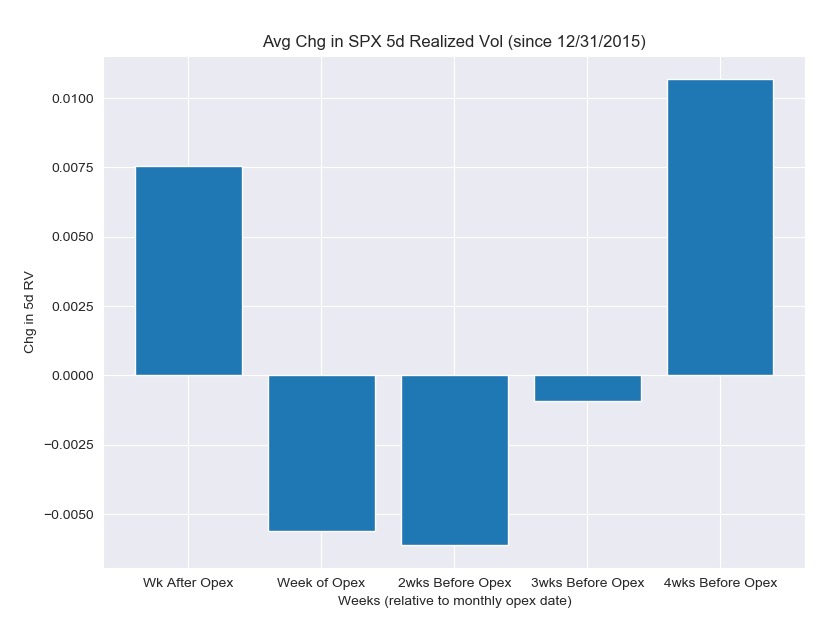
Just before March we posted this note discussing the March expiration, which included this chart from @Pat_Hennessey showing how volatility moves around expiration. This supports the idea that volatility expands after expiration, which is not to say the market must “turn” after expiration.

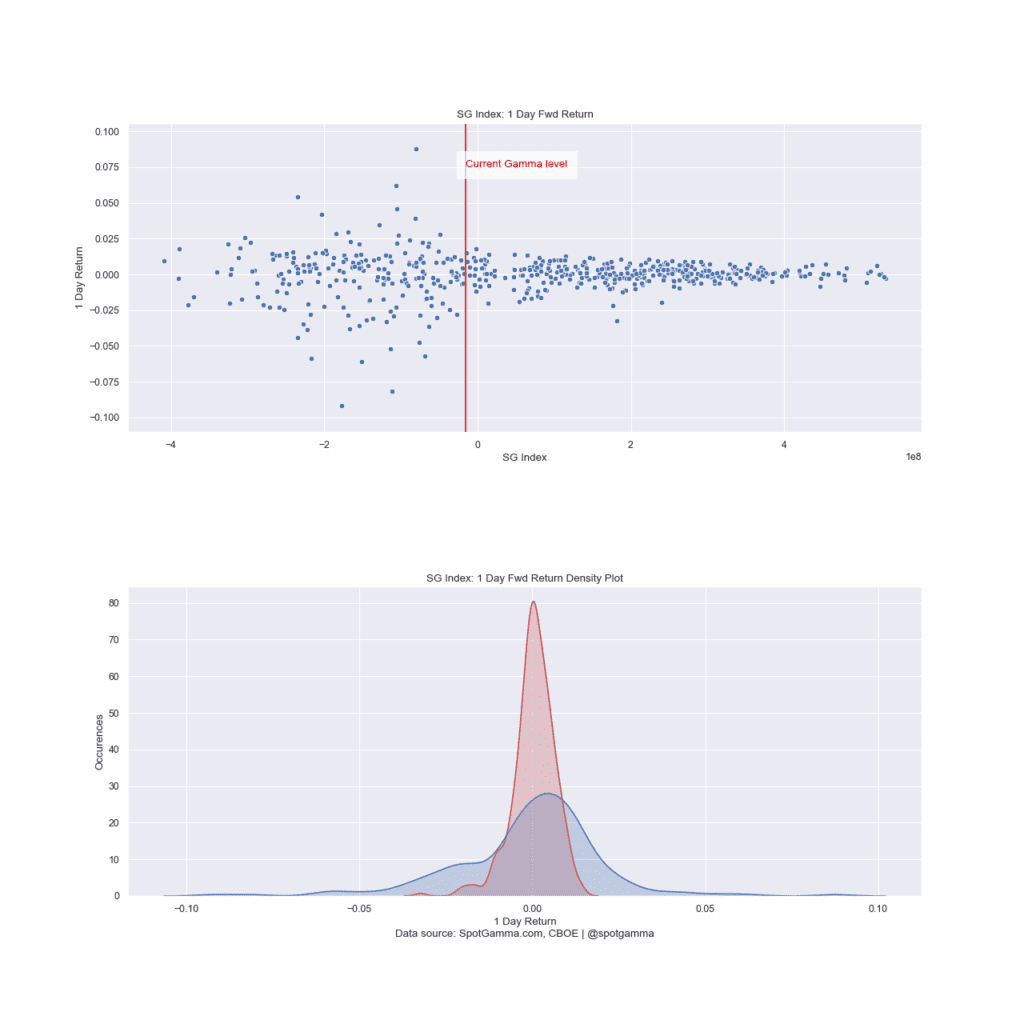
Finally, if you look at the SG Gamma Index (our proprietary gamma level) you can see it is forecasting moderate volatility. However it is on the cusp of predicting higher volatility levels if the SPX index moves lower (and/or put volume increases).

