The following is a guest post courtesy of Michael Kramer of Mott Capital Management.
There is instability in the bond market right now.
In the face of a potential break, there may be a wave of volatility as market participants begin to price in changes to Fed monetary policy.
Cracks are already showing as bond yields rocketed higher amidst expectations the Fed may speed their taper to bond-buying as well as hike interest rates, sooner; this has resulted in ETFs like the iShares High Yield ETF (HYG) and the iShares Corporate Bond ETF (LQD) to drop as the yields for the underlying assets rise.
Declining prices in these ETFs may be a precursor to rising volatility in the equity market, as the spreads between corporate and high yield bonds and U.S. Treasuries widen.
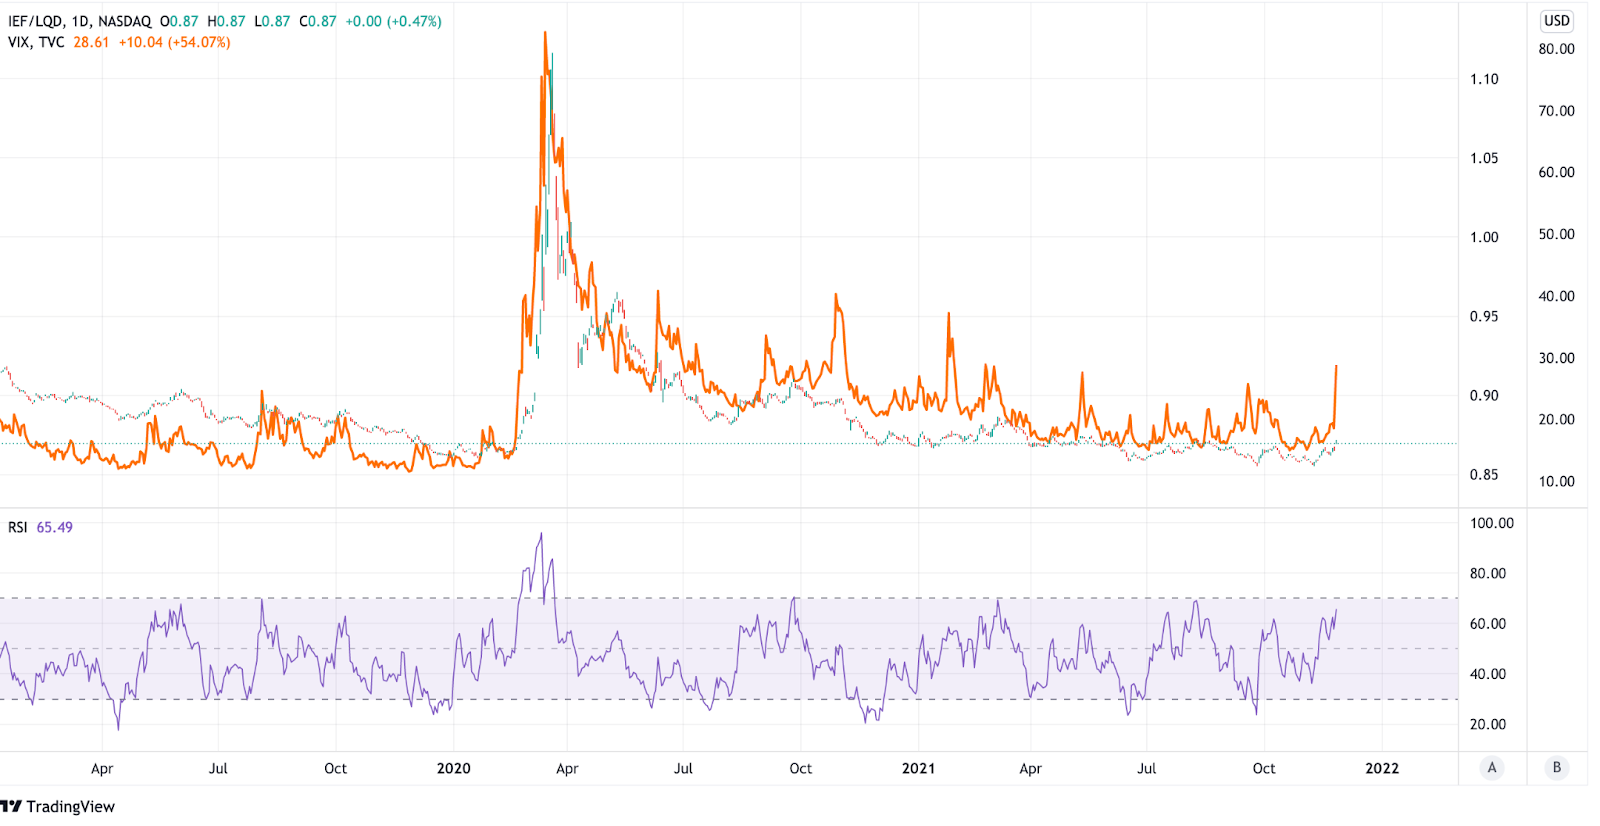
One way to measure this relationship is to divide the iShares 7 to 10-year Treasury Bond ETF (IEF) by the LQD, creating a ratio that closely mimics the VIX volatility index.
SpotGamma Equity Hub Models
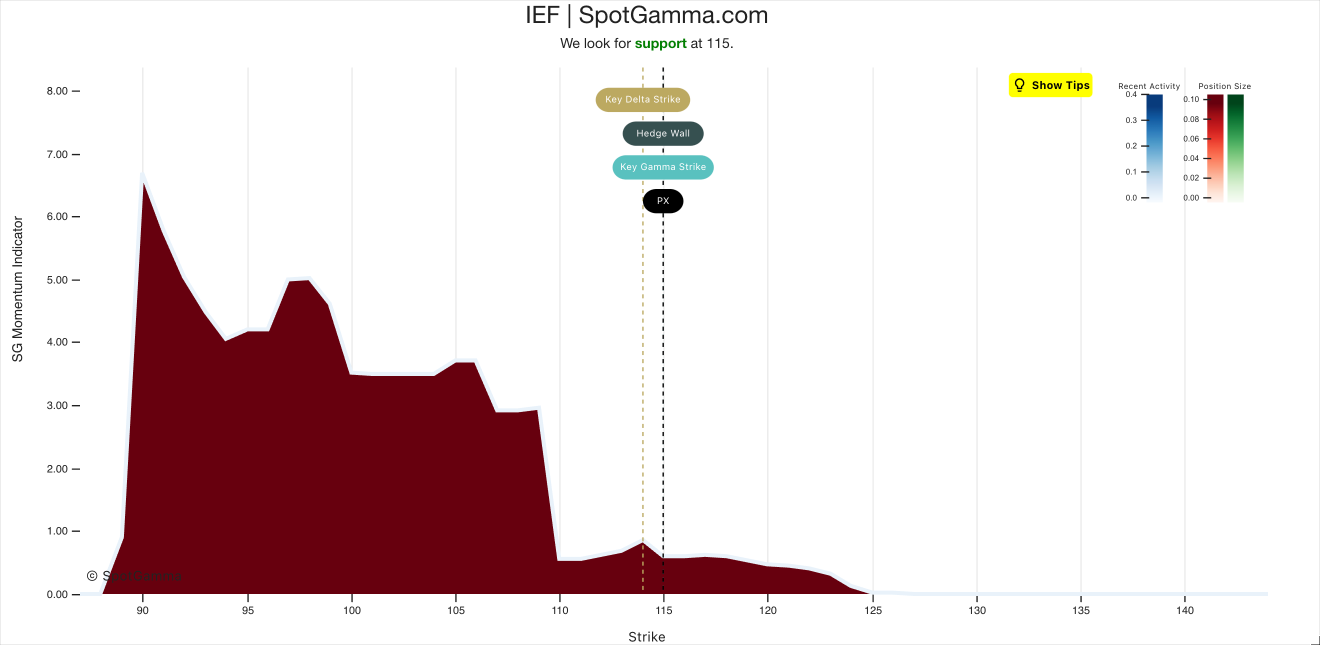
SpotGamma Equity Hub’s modeling of options market gamma positioning, reveals the trigger points where these bond ETFs could come under considerable pressure if broken.
The current SpotGamma model for the IEF ETF shows that once the IEF slips below $114, it could drop to $110, the next area that offers strong gamma support.
A 3% drop in an ETF doesn’t sound like a lot, but that implies rates for Treasuries rise sharply, and the 10-year yield rises above 1.8%.
There is a similar sort of aggressive positioning in the LQD ETF; the Equity Hub model shows that a drop below $129 may portend a decline to $124.
At that point, rates on corporate bonds would be at levels not seen since August 2019, much higher than today.

But more importantly, is what would happen to the IEF/LQD ratio and what it would mean for the equity markets.
At $124 on the LQD and $110 on the IEF, the ratio would jump to nearly 0.89, up from its current ratio of 0.87.
These are levels not seen since October and November 2020!
When that ratio rises, it tends to be associated with a VIX index that moves higher and well north of 20.
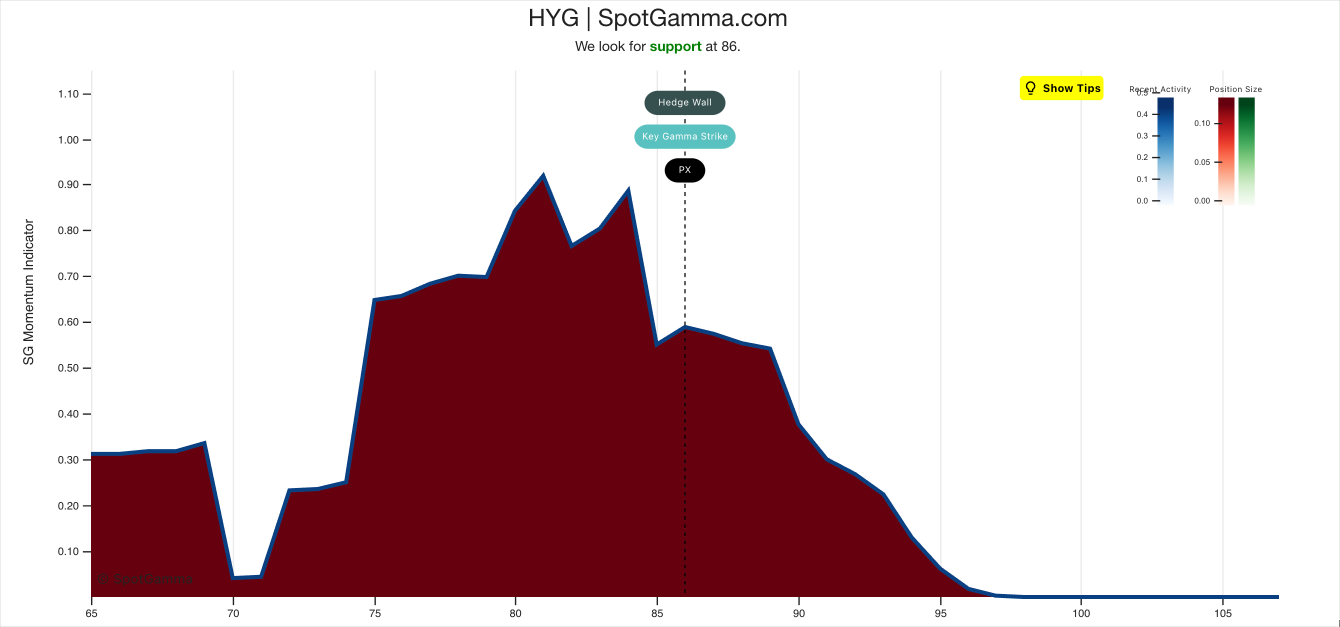
The Equity Hub Model also indicates a potential drop to $84 for the HYG, if it falls below $86. A drop like this would push the ratio, versus the IEF, much higher to about 1.48 from its current 1.32.
A jump to 1.48 would indicate both that the VIX is higher than its current levels, and more stress in the markets.
Trigger Points
This isn’t to say yields are due for a massive move higher.
However, it tells investors that the critical levels, once broken, could result in intense movements in the bond markets, soaring yields, and widening spreads. This type of scenario would likely cause a great deal of stress in the equity market and trigger a rise in the VIX.
The Equity Hub models are helping to gauge where the trigger points are and where these bond proxy ETFs could go.
The biggest worry here is that the ETFs mentioned above are not all that far from falling below their trigger points. If expectations for the Fed tapering faster or raising rates sooner grow louder, then it looks likely that rates will push higher, and, at this point, it may be all that is needed to put everything in motion and for the bond proxy ETFs to drop further.