Stocks Rebound After Last Week’s Selloff
The S&P 500 closed Friday at 7,563, up about 2.5% on the week. The rebound from last Thursday’s selloff held through a hot CPI report, Treasury yields near 5%, and a shock from NVDA as CEO Jensen Huang resigned Thursday amid a board investigation.
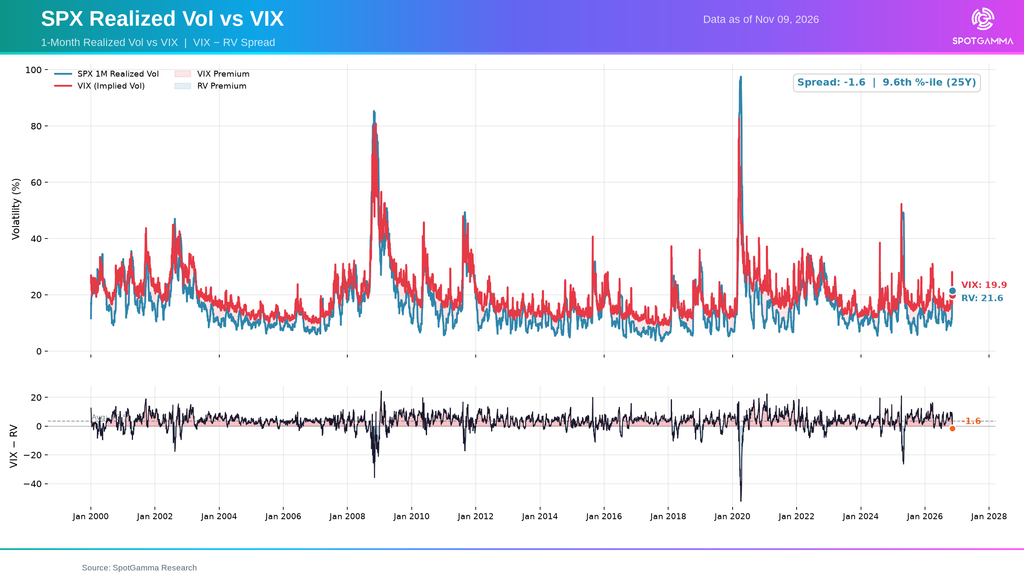
This was certainly not a calm recovery. SPX traded in a range of 1% or more in every session, and Monday alone saw a gain of 2.4%. One-month realized volatility, which measures actual underlying price movement, now sits near 20%.
Last Sunday, we showed how negative gamma accelerated the November 5 selloff. Negative gamma still covered most of SPX’s trading range this week, which helps explain the wide daily swings. But another Greek exerted a strong influence on market direction: vanna.
How a Vanna Rally Lifted Stocks Last Week
While dealer gamma became a central focus last week, vanna took center stage Monday. Vanna measures how much an option’s delta changes when implied volatility changes.
The larger a dealer’s vanna exposure, the more stock or futures they need to buy or sell to stay hedged as implied volatility moves. When implied volatility falls, that adjustment means net buying from dealers, which can lift the market.
The fuel behind the market’s rebound came exactly from this collapse in implied volatility. Our pre-market Founder’s Note on Monday morning described volatility as “warmed up” and noted that traders could “slam these vols back down, which would jack up stock prices.”
The VIX then collapsed nearly 23% on Monday alone, the 15th-largest one-day percentage drop since 1990. By Wednesday close the SPX Term Structure showed vols nearly back to pre-selloff levels.
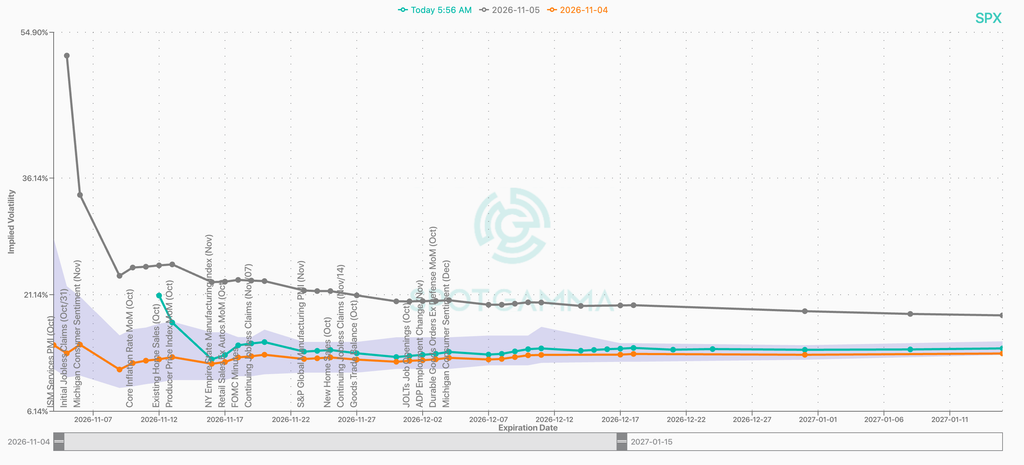
How did this phenomenon lead to the market rebound?
As implied vol fell dramatically, downside puts that were bought to open lost value quickly. Dealers who sold those puts had sold stock or underlying initially as a hedge.
Due to the vanna effect, dealers then unwound their hedges as implied volatility declined. This buyback lifted the index in a phenomenon described as a vanna rally, providing jetpack fuel for a sharp increase.
By Friday, most of that fuel looked spent. With implied volatility now below realized volatility, the data suggests next week’s events, rather than falling volatility, will likely drive the next move.
The NVDA Saga: The Story Told Through Options Positioning
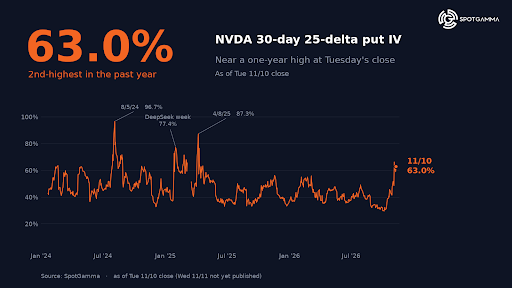
As news broke regarding NVDA CEO Jensen Huang’s affairs last week, options traders began paying up for protection. NVDA’s 30-day 25-delta put IV reached 63% on Tuesday, its second-highest reading in the past year.
Thursday’s open marked the low for NVDA at $148.80, near a key support level at $150. From there, positioning began to turn: FlowPatrol showed NVDA leading all equities with $1.07 billion in delta exposure, which largely came from the closing of long December and January puts. Call premium topped $475 million that day, the most of any ticker.
By Friday, our Compass scanner showed the stock had moved toward call skew, which suggests traders are once again leaning into upside exposure.
As an example, Friday’s Opening Setup report flagged a $50 million NVDA long call spread for 43k contracts at the $175 and $225 strikes, expiring March 2027. Note that this position opened on a down day, when NVDA sat 30% below its October high.
The above trade was bought with NVDA front-month IV near 60 and an IV Rank of 95, so upside was not cheap. Paying this kind of premium suggests some large traders view the selloff as overdone, and NVDA’s November 17 earnings remain the next test.
What We Are Watching Into Next Week
SPX closed Friday at 7,563, below our 7,590 Risk Pivot heading into the weekend with 7,700 as major resistance and 7,400 as major support. As of now, the data points to a sideways yet cautious market until next week’s events pass.
The week ahead packs several major events into four days, each with the potential to clear risk from — or introduce shocks to – the overall market:
- Tuesday, Nov. 17: NVDA earnings (post-close), Microsoft Ignite conference
- Wednesday, Nov. 18: VIX options expiration
- Thursday, Nov. 19: Estimated Anthropic IPO
- Friday, Nov. 20: Monthly options expiration (OPEX)
This sits on top of retail earnings next week, which include HD, WMT, TGT, and COST. If these events pass without a shock, the landscape could change dramatically as much of the hedging built up this month rolls off.
Current positioning suggests there is room for a move higher into Thanksgiving week, much like last November’s rebound from OPEX into Black Friday.
Event-heavy weeks can bring sharp moves in both directions, and implied volatility can reprice quickly around each release. Holiday sessions also tend to see lighter volume, which can exaggerate moves. We’ll be watching to see if SPX can reclaim 7,590 level, and if vols change meaningfully as the above events pass.