NVIDIA (NVDA) reports fiscal third-quarter earnings Tuesday, November 17, after the close, facing its most unusual setup in years: exceptional AI demand alongside a sudden leadership transition.
Jensen Huang’s resignation and CFO Colette Kress’s appointment as interim CEO have shifted the debate beyond whether NVIDIA can beat estimates. Investors want evidence that its product roadmap, customer relationships and execution remain intact. Shares fell from Friday’s $162.85 close to roughly $156 in Monday trading, while options price an outsized reaction.
1. What Is the Options Market Pricing?
Based on Monday, November 16 intraday pricing, the November 20 at-the-money straddle cost approximately $16.05, implying a 10.3% move and a weekly range near $140-$172 from a roughly $156 stock price. A separate one-standard-deviation volatility estimate indicated a wider $136-$176 range. These methods are not interchangeable.
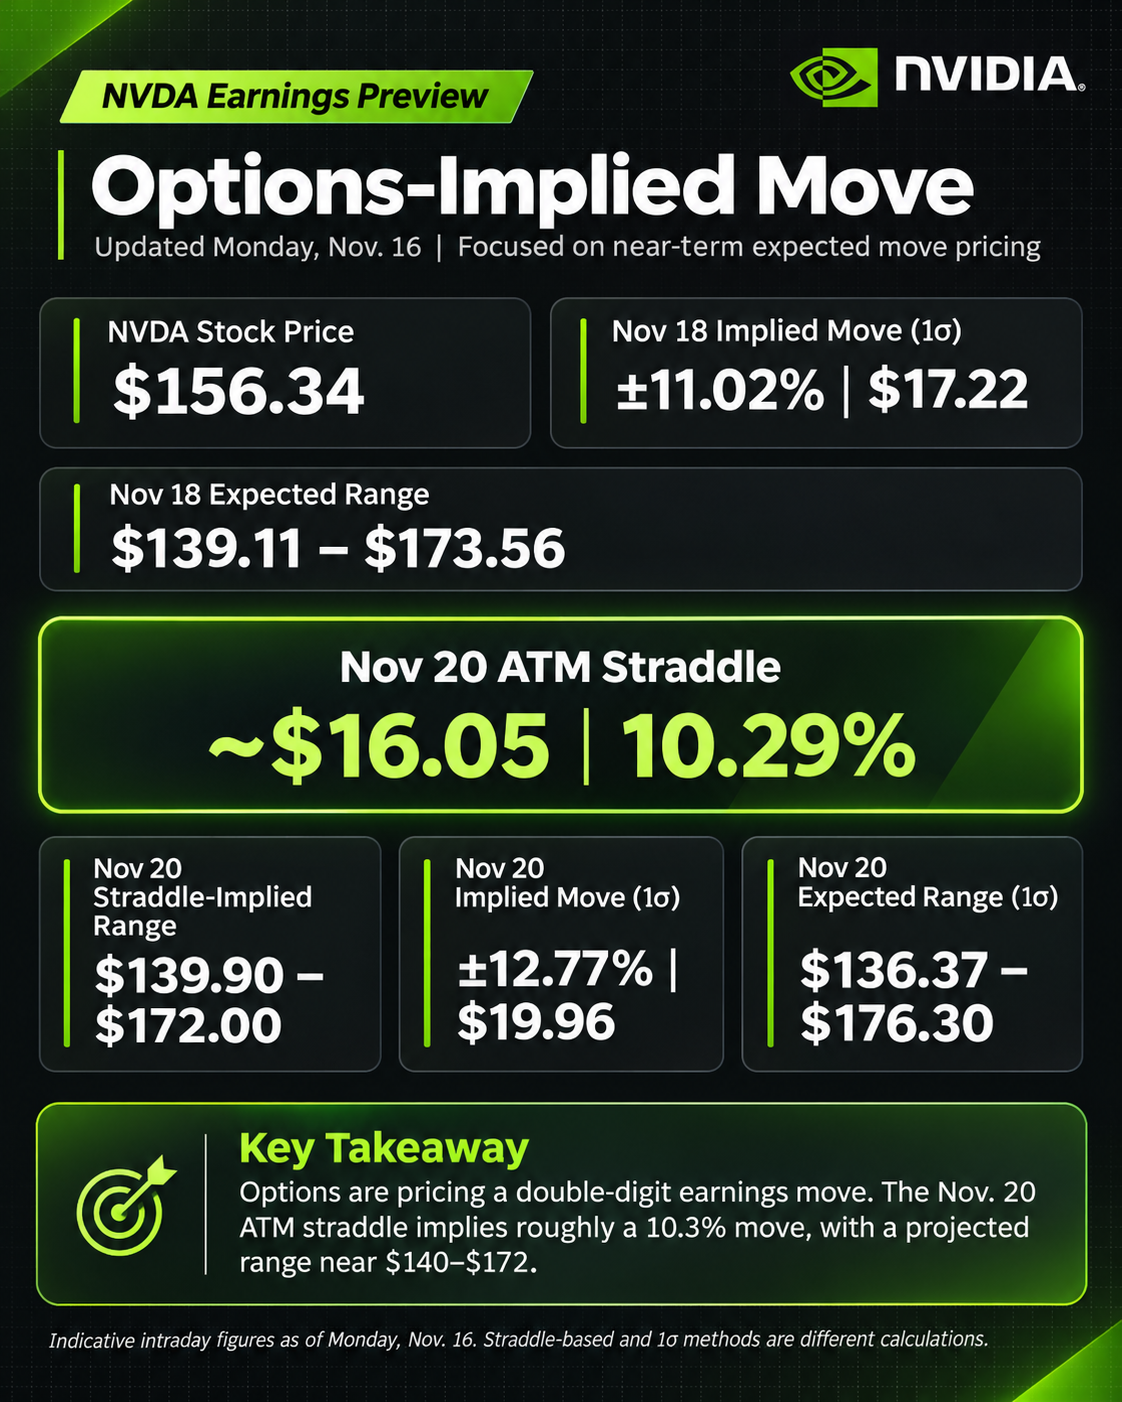
That pricing is elevated relative to NVIDIA’s average 4% absolute reaction over its last eight earnings reports. It also brings SpotGamma’s $150 gamma concentration much closer to spot than it was Friday.
The options market is demanding a substantial move. Outright calls or puts can lose value even with a correct directional call if realized movement disappoints or implied volatility collapses after the announcement.
2. Volatility Skew: Downside Insurance Is Expensive
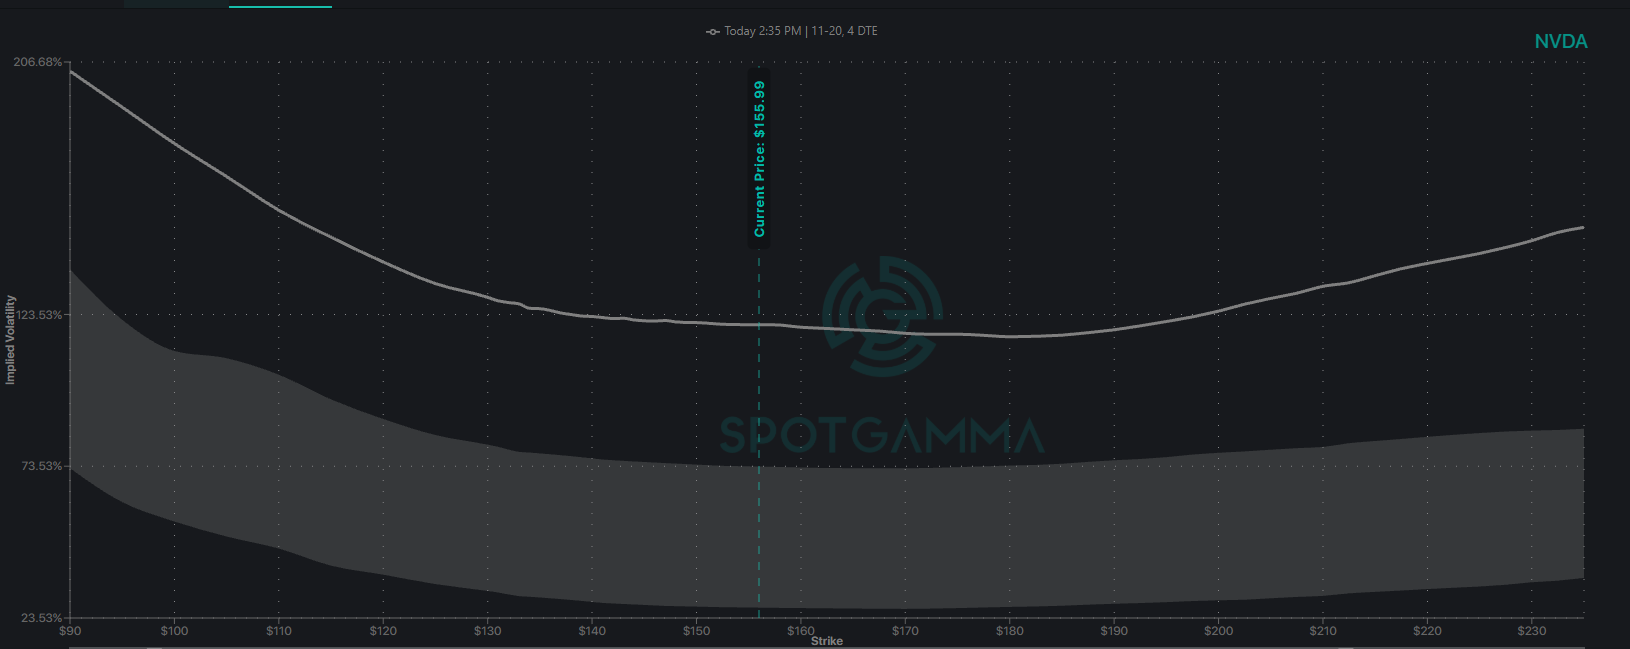
SpotGamma’s November 13 skew snapshot shows elevated implied volatility on both wings of the November 20 expiration. At the $120 put strike, volatility approached 111%, above the chart’s 90th-percentile reference near 98%.
That steep downside wing reflects expensive protection against another sharp decline. Upside-strike volatility also rises, indicating the market prices meaningful rebound potential rather than exclusively bearish outcomes.
The key trading implication is event-volatility risk. After earnings, volatility premiums can contract sharply even if NVDA moves in the expected direction. A volatility smile is a measure of option pricing, not a forecast that either tail outcome will occur.
3. Dealer Gamma: $150 Downside Reference, $175-$190 Upside Test
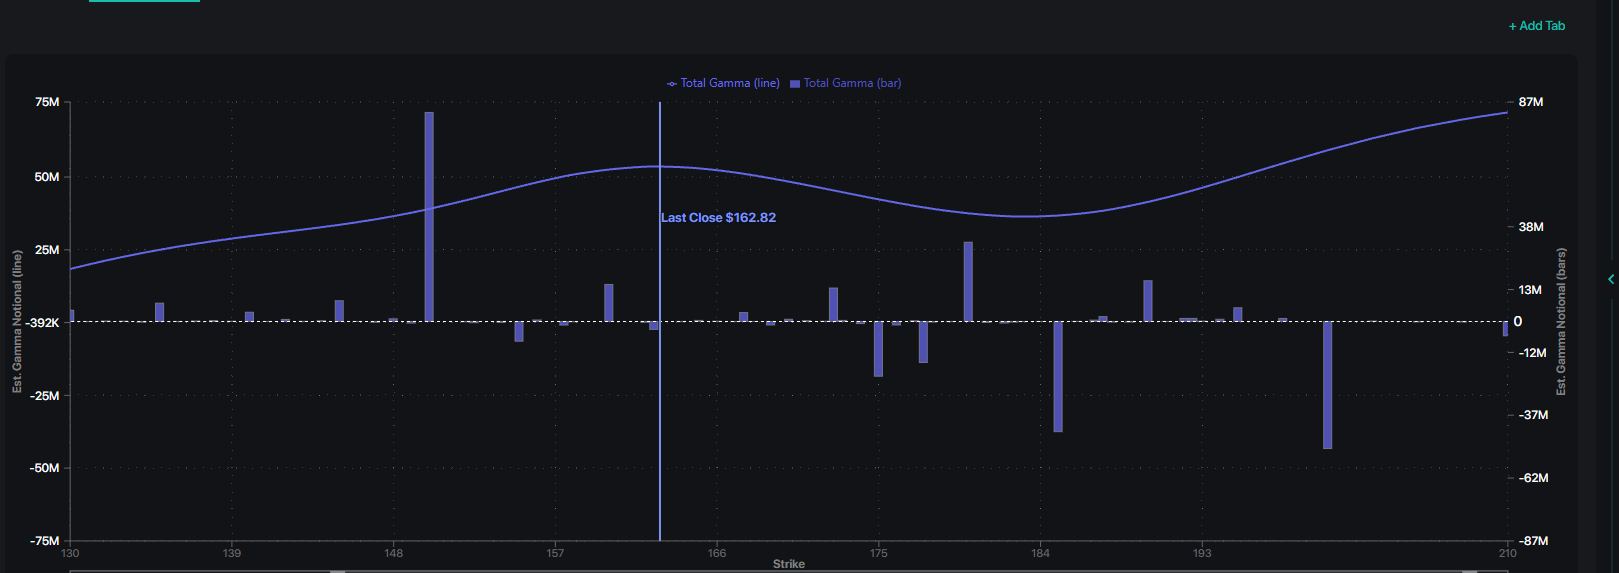
SpotGamma’s November 13 Synthetic OI gamma map shows a local peak in aggregate positive gamma near $160-$165, while the largest individual positive gamma concentration sits at $150. That strike is a key downside reference following Monday’s decline.
When dealers are effectively long gamma, hedging may dampen price swings; negative gamma can reinforce directional movement. On NVIDIA’s upside, positioning is mixed across $175-$190, potentially producing a less orderly rally.
A sustained break below $150 would weaken the stabilization thesis. Conversely, acceptance above $175-$180 could shift attention toward $190. There is also notable negative gamma exposure around $200.
These levels are positioning estimates, not automatic support or resistance. A large earnings gap or post-report option repositioning can quickly change the map.
4. Fundamental Catalysts: Growth Meets a Governance Test
NVIDIA posted $96.2 billion in revenue last quarter, including roughly $89 billion from Data Center, and adjusted EPS of $2.22. It guided for fiscal Q3 revenue of $108 billion, plus or minus 2%, with gross margin near 74%. Wall Street expects roughly $109 billion in revenue and $2.47 in adjusted EPS.
Four areas will drive the reaction:
- AI demand and supply: Are Blackwell deployments and the Vera Rubin ramp progressing without disruption?
- Margins: Can NVIDIA defend profitability as memory costs and product mix shift?
- Forward guidance: Does management sustain confidence in hyperscaler demand and the next quarter’s growth?
- Leadership: Can Kress demonstrate continuity in strategy, customer commitments and succession planning?
An earnings beat may not be enough if guidance or management commentary leaves investors uncertain about execution without Huang.
5. Three Post-Earnings Scenarios
Monday’s roughly $140-$172 straddle-implied weekly range frames the immediate event, while the November 13 gamma map offers separate positioning levels.
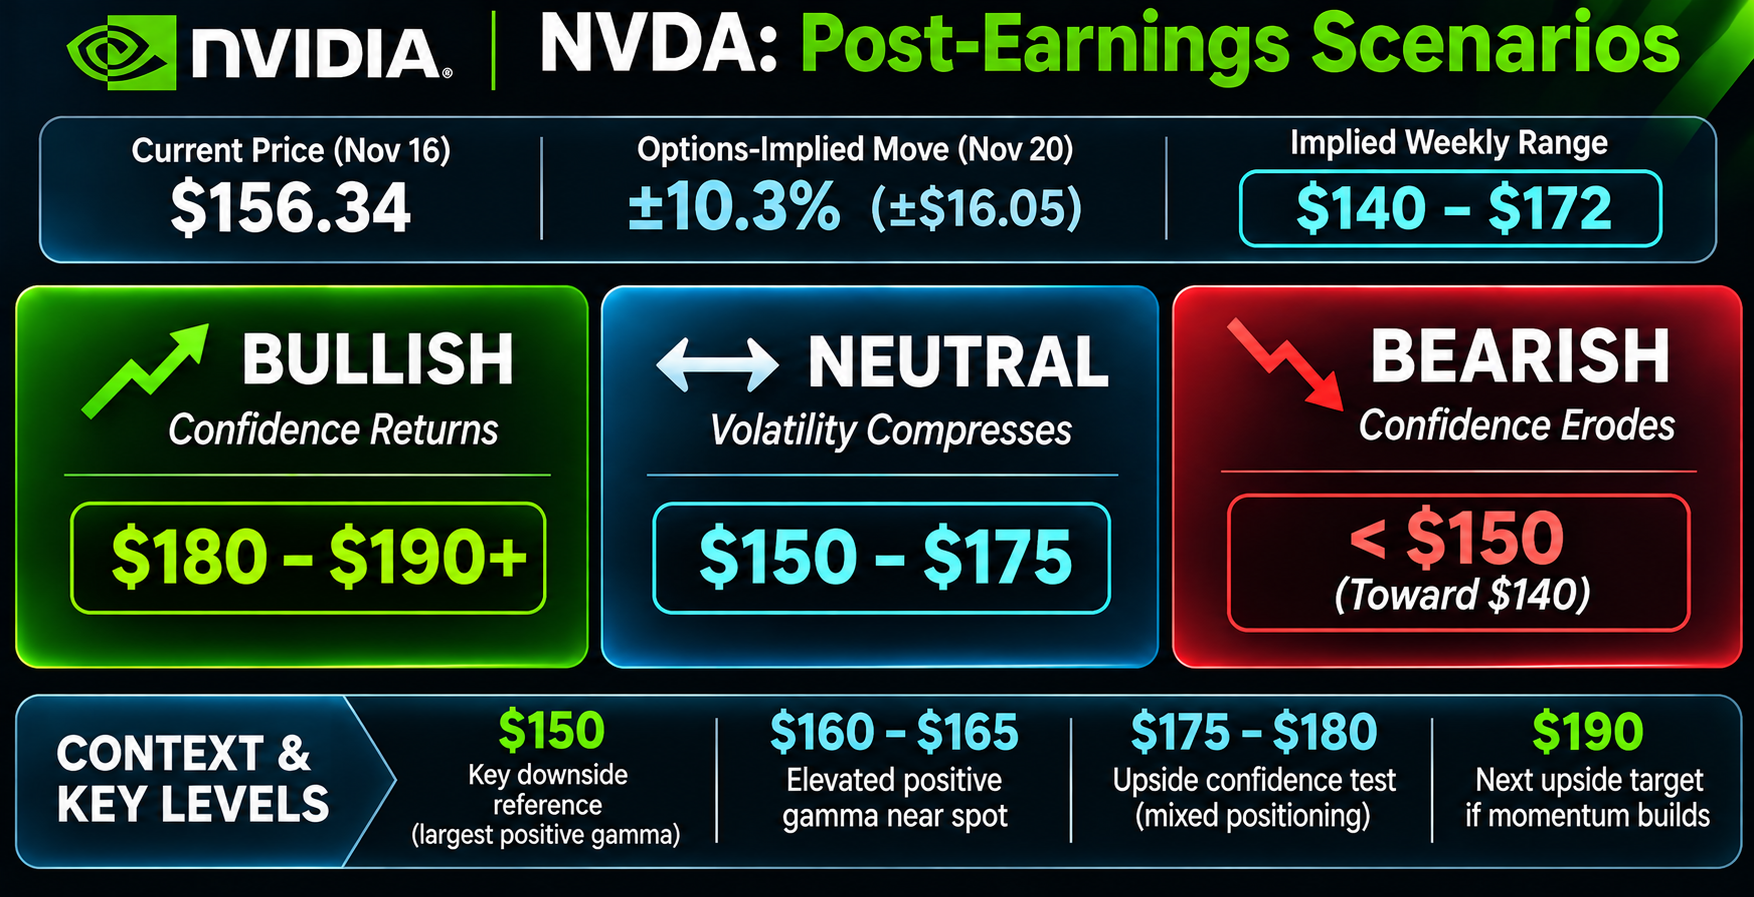
Bullish — confidence returns ($180-$190+): Strong guidance, stable margins and reassurance about management restore risk appetite. Sustained trading above $175-$180 would exceed the straddle-implied upper range and put $190 in focus.
Neutral — volatility compresses ($150-$175): Results are solid but leadership questions persist. Shares stabilize near existing gamma concentrations as earnings premium comes out of options.
Bearish — confidence erodes (below $150 toward $140): Weak forward commentary or execution concerns push shares through the $150 reference. The $140 area aligns approximately with the lower straddle-implied weekly boundary.
Because the market is pricing a gap, regular-session acceptance after the initial reaction matters more than the opening print alone.
6. Options Trade Idea: December Call Butterfly
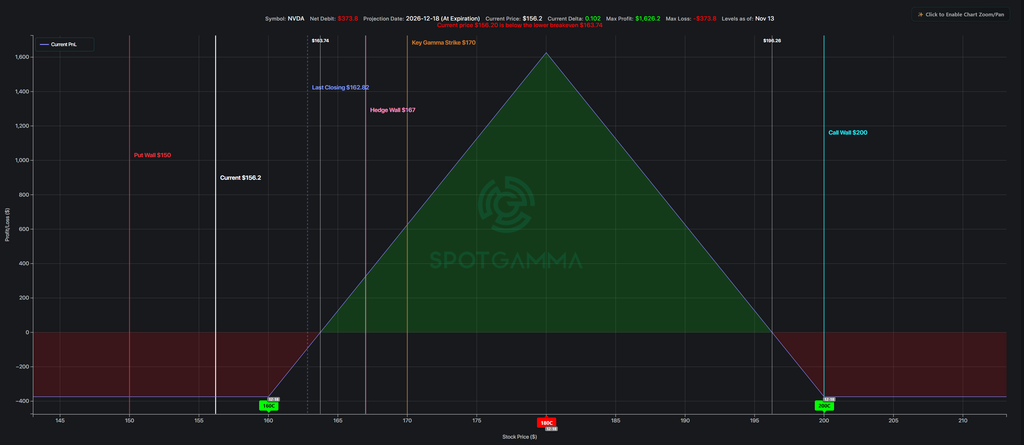
For traders expecting a bullish rebound toward $180, the December 18 call butterfly offers a defined-risk alternative to buying expensive short-dated calls. The trade also allows for a month of time to play out in order for the directional move to occur.
Illustrative NVDA December 18 $160/$180/$200 call butterfly:
- Buy one $160 call, sell two $180 calls and buy one $200 call.
- Indicative debit: $3.75
- Maximum expiration profit: $1,625 if NVDA finishes exactly at $180.
- Maximum loss: $375, with expiration breakevens near $163.75 and $196.25.
The trade allows several weeks for NVIDIA to stabilize and recover. It is best suited to a controlled advance toward $175-$185, not a breakout far beyond $200.
Crucially, the maximum theoretical profit applies at expiration. A rally toward $180 earlier may deliver substantially less, depending on time remaining and volatility. The full debit can be lost if shares finish at or below $160 or at or above $200.
Final Thoughts
NVIDIA’s report will test more than its ability to deliver another record quarter. Investors will evaluate whether extraordinary AI demand can overcome the uncertainty of a sudden CEO transition.
The setup centers on $150 as the downside gamma reference and $175-$180 as an upside confidence test. The decisive signal will be whether investors rebuild exposure—and whether price action holds up after earnings volatility resets.