• Skip to content
  • Skip to primary sidebar

SpotGamma™

S&P 500 Stock Market Gamma Trading Levels Based on Options Open Interest

  • Subscribe Now
  • Products
  • Blog
  • FAQ
  • Contact
    • About
  • Members
    • Account
    • Portal
    • Equity Hub 2.0

Jul 30 2020

AAPL, FB, AMZN Earnings Gamma Chart Pack

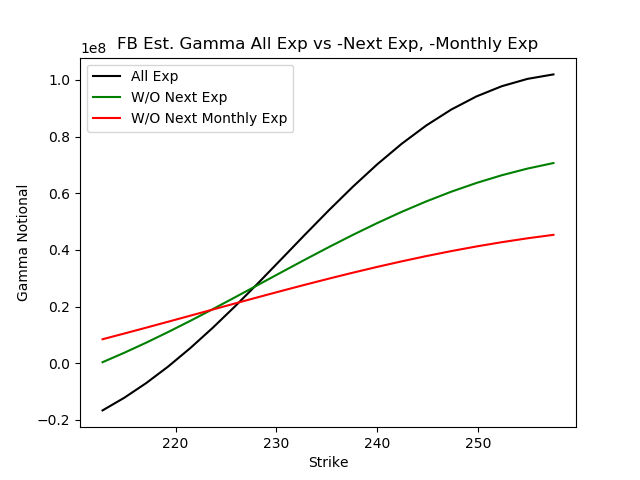
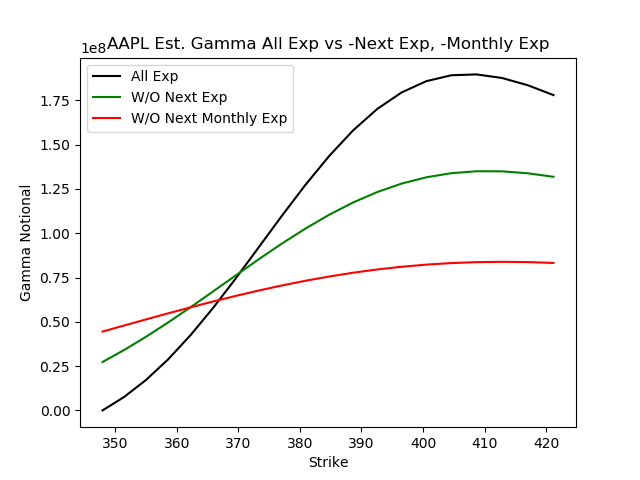
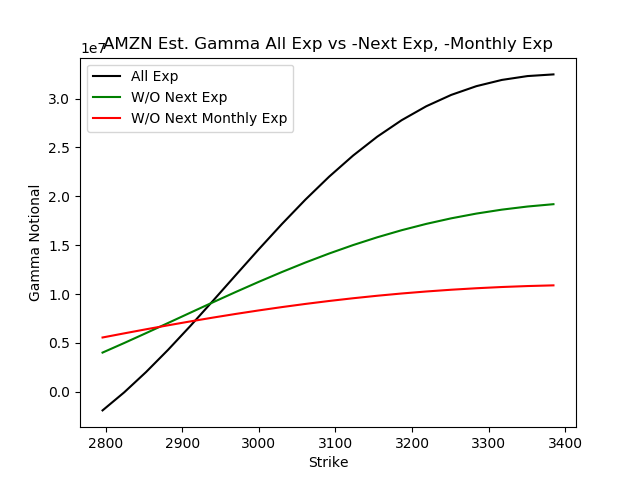
Below we show two styles of charts. The first (red, black, green lines) show how much gamma is tied to various expirations. The more gamma there is the more volatility these stocks may have. This is due to our assumption that stocks maintain a negative gamma stance as traders are primarily call buyers (and dealers are short).

AMZN options gamma into expiration

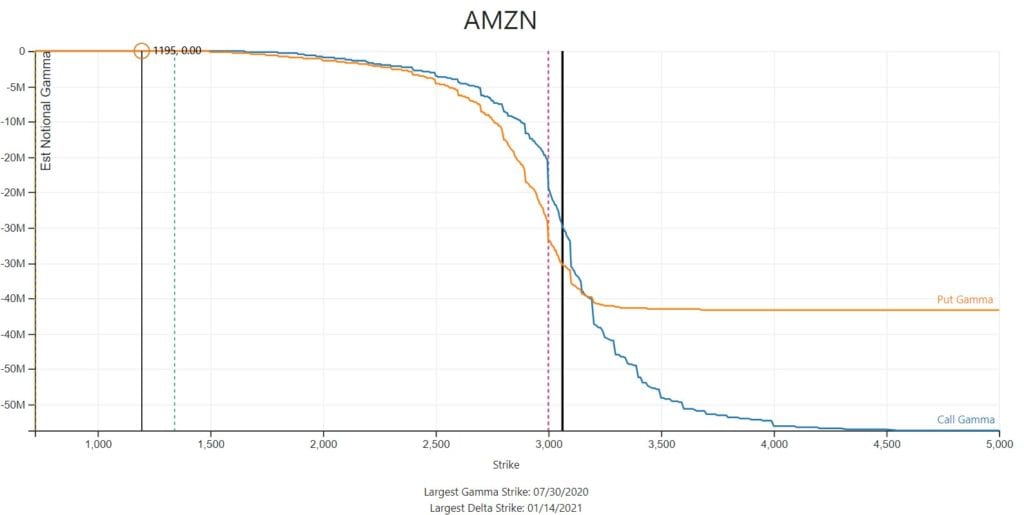
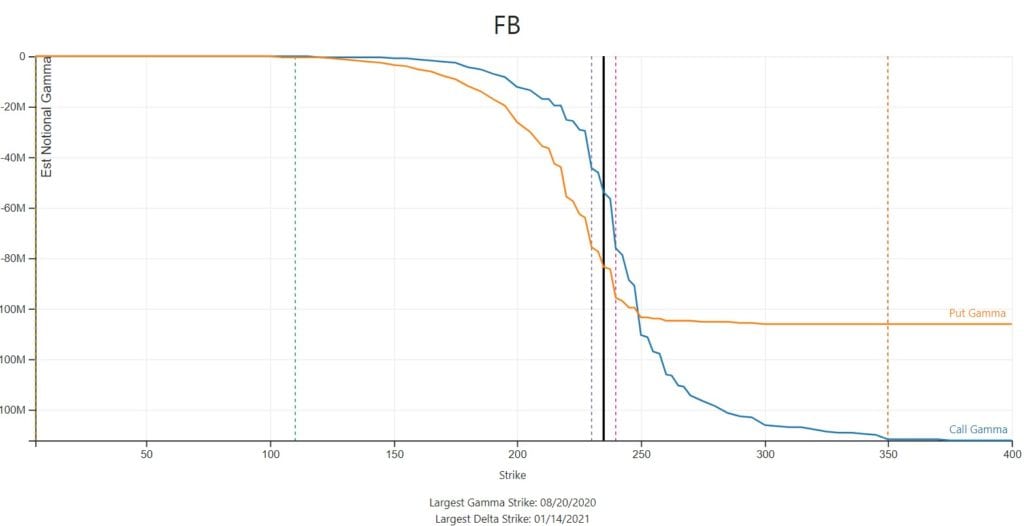
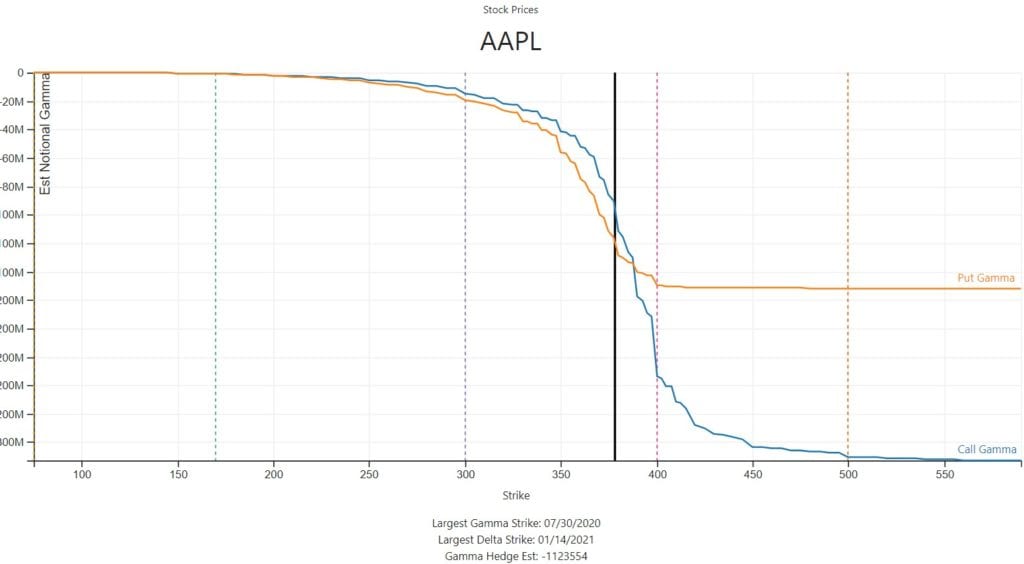
The second type of chart highlights where hedging flows may kick in, and we look at where put gamma and call gamma levels diverge. For example around the 3200 level in AMZN.

AMZN options gamma into expiration
FB options gamma into expiration
AAPL options gamma expiration
  • Click to share on Twitter (Opens in new window)
  • Click to share on Facebook (Opens in new window)
  • Click to share on LinkedIn (Opens in new window)
  • Click to share on Reddit (Opens in new window)

Written by Spot Gamma · Categorized: Market Analysis, Stock · Tagged: AAPL, AMZN, earnings, FB

Primary Sidebar

Popular Posts

spotgamma-sidebar-weaponized-gamma-sidebar
spotgamma-sidebar-yolo-trade
did-softbank-weaponize-options-gamma-whale
goldman-gamma-op-ex-option-driven-equity-flow
spotgamma-on-the-market-huddle

Categories

  • Market Analysis (258)
  • SpotGamma Updates (4)
  • Stock (47)
  • Trade (3)
Follow @spotgamma on Twitter!
  • Subscribe
  • Disclaimer
  • Account
  • Portal

©2021 TenTen Capital LLC DBA SpotGamma