• Skip to main content
  • Skip to primary sidebar

SpotGamma™

S&P 500 Stock Market Gamma Trading Levels Based on Options Open Interest

  • About
  • Pricing
  • Academy
  • Resources
    • Tool Demos
    • Case Studies
    • Blog
    • Support Center
    • Free Daily Report
    • Free Trading Tools
      • Options Profit Calculator
      • SPX Gamma Exposure
      • Implied Earnings Moves
      • Volatility Ranking
    • Free Training
    • Report Card
  • Login

AMZN

Mar 12 2025

AMZN Reversal Trade at Gamma Wall Delivers 8:1 Intraday Short

Doug-Pless-AMZN-SpotGamma-Case-Study-March-2025

When price meets positioning, the market often tells you exactly what to do. In this intraday Amazon (AMZN) case study from March 11, SpotGamma tools identified a high‑probability bearish reversal as price stalled at a major gamma level. By combining Equity Hub levels with HIRO flow signals, this trade captured a sharp move lower with […]

Written by SpotGamma · Categorized: Case Study · Tagged: AMZN, Case Study, Doug Pless

Jul 07 2021

AMZN Topping Out?

amzn-overextended-at-3700-spotgamma

This morning we highlighted that positive news and a huge number of call options traded likely gamma squeezed AMZN up over $3700. However our EquityHub data showed that most of the gamma in Amazon was tied to the $3600 strike which indicates that at $3700 (opening prices on 7/7) the stock is likely overextended.

Written by developer · Categorized: Market Analysis, Stock · Tagged: AMZN, gamma squeeze

Jul 30 2020

AAPL, FB, AMZN Earnings Gamma Chart Pack
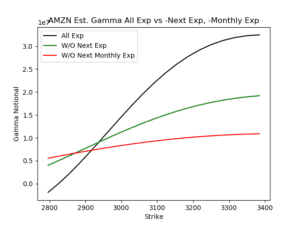
Below we show two styles of charts. The first (red, black, green lines) show how much gamma is tied to various expirations. The more gamma there is the more volatility these stocks may have. This is due to our assumption that stocks maintain a negative gamma stance as traders are primarily call buyers (and dealers […]

Written by SpotGamma · Categorized: Market Analysis, Stock · Tagged: AAPL, AMZN, earnings, FB

Jul 02 2020

Equity Options Gamma Shows Stretch

Our equity options gamma indicators are showing that negative gamma rates in single stocks are growing back to where record levels were a few weeks ago. Back then there was news of “record small trader” positions in call options. You can see there is a similar position below. In the charts below for TSLA, AMZN, […]

Written by SpotGamma · Categorized: Market Analysis · Tagged: AMZN, call positions, option gamma, TSLA

Primary Sidebar

SpotGamma-Subscriber-Signup-Banner

  • Volatility Has Compressed. What Happens Next?
  • Another SpaceX Unlock, and Why $150 Still Caps the Stock
  • Options Exchange Monitor — Week of August 15, 2026 (36 SEC notices, 2 CFTC, 0 EDGAR)
  • GEX Levels for SPY, QQQ, ES and NQ: Using Index Gamma in Any Product
  • How to Trade GEX Levels: A Practical Guide to Gamma-Based Trading
  • youtube
  • x
  • Privacy Policy
  • Disclaimer
  • Terms & Conditions
  • Support Center
  • Media
  • Contact Us

©2026 TenTen Capital LLC DBA SpotGamma

All SpotGamma materials, information, and presentations are for educational purposes only and should not be considered specific investment advice nor recommendations. Futures, foreign currency and options trading contains substantial risk and is not for every investor. An investor could potentially lose all or more than the initial investment. Risk capital is money that can be lost without jeopardizing one's financial security or lifestyle. Only risk capital should be used for trading and only those with sufficient risk capital should consider trading. Past performance is not necessarily indicative of future results. Testimonials appearing on this website may not be representative of other clients or customers and is not a guarantee of future performance or success.

View Full Risk Disclosure