Macro Theme:
Daily Note:
NOTE TO FOLLOW PREOPEN
| SpotGamma Proprietary SPX Levels | Latest Data | SPX Previous | SPY | NDX | QQQ |
|---|---|---|---|---|---|
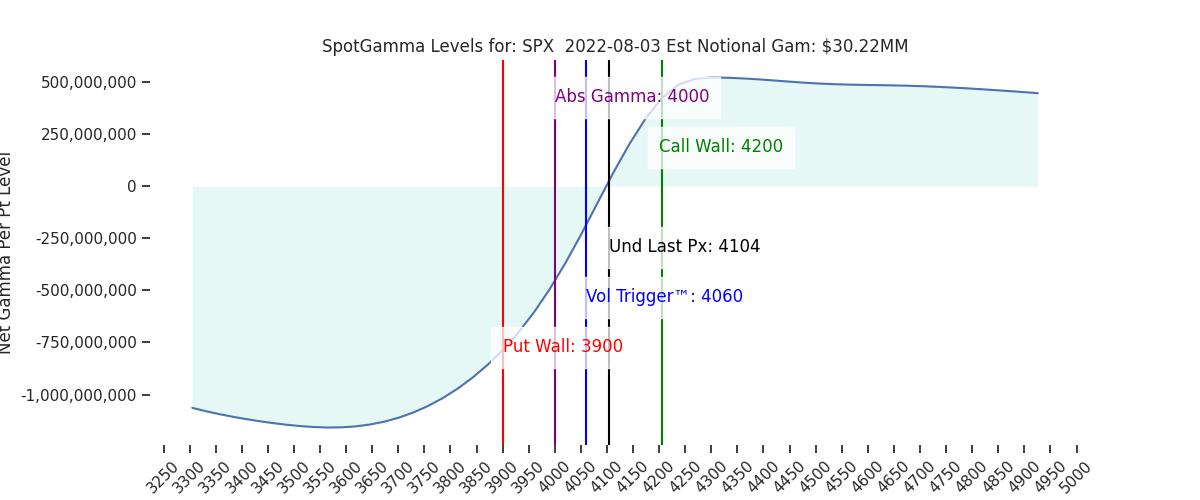
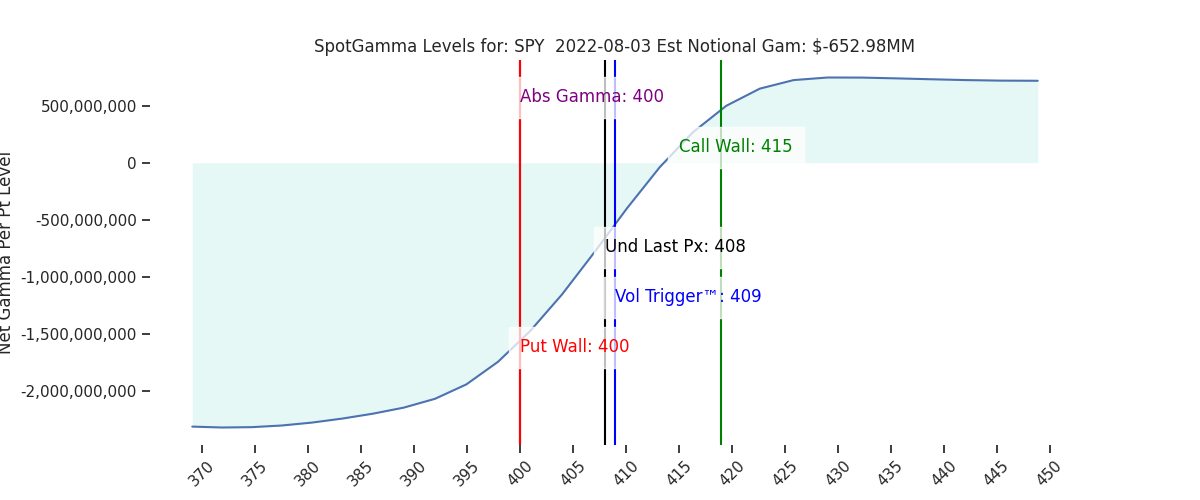
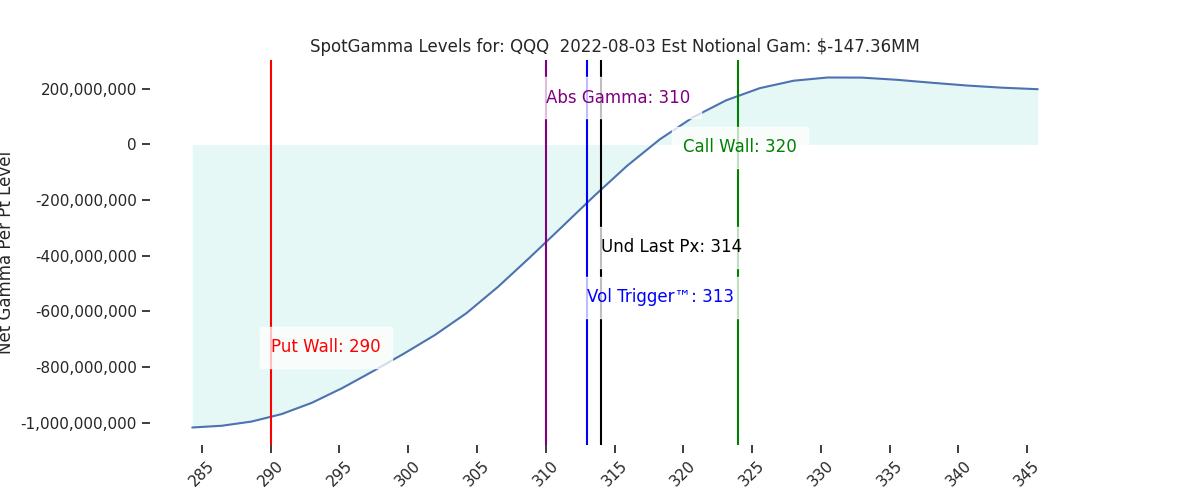
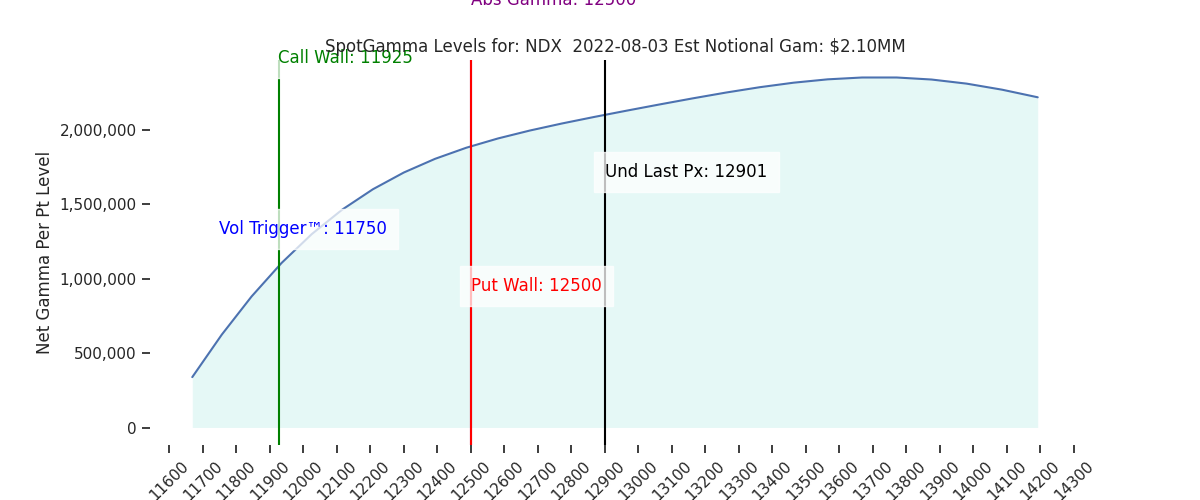
| Ref Price: | 4104 | 4104 | 408 | 12901 | 314 |
| SpotGamma Imp. 1 Day Move: Est 1 StdDev Open to Close Range |
1.22%, | (±pts): 50.0 | VIX 1 Day Impl. Move:1.5% | ||
| SpotGamma Imp. 5 Day Move: | 3.12% | 4130 (Monday Ref Px) | Range: 4002.0 | 4259.0 | ||
| SpotGamma Gamma Index™: | 0.23 | 0.45 | -0.12 | 0.01 | -0.02 |
| Volatility Trigger™: | 4060 | 4000 | 409 | 11750 | 313 |
| SpotGamma Absolute Gamma Strike: | 4000 | 4000 | 400 | 12500 | 310 |
| Gamma Notional(MM): | 30.0 | 32.52 | -653.0 | 2.0 | -147.0 |
| Additional Key Levels | Latest Data | Previous | SPY | NDX | QQQ |
|---|---|---|---|---|---|
| Zero Gamma Level: | 4085 | 4085 | 0 | 0 | 0 |
| Put Wall Support: | 3900 | 3900 | 400 | 12500 | 290 |
| Call Wall Strike: | 4200 | 4200 | 415 | 11925 | 320 |
| CP Gam Tilt: | 1.07 | 1.02 | 0.8 | 1.18 | 0.9 |
| Delta Neutral Px: | 4070 | ||||
| Net Delta(MM): | $1,592,561 | $1,609,690 | $190,750 | $62,048 | $100,931 |
| 25D Risk Reversal | -0.08 | -0.07 | -0.07 | -0.08 | -0.08 |
| Call Volume | 382,334 | 375,034 | 2,374,628 | 7,108 | 815,911 |
| Put Volume | 726,177 | 793,173 | 3,571,263 | 6,152 | 1,252,312 |
| Call Open Interest | 5,650,688 | 5,610,587 | 7,173,294 | 61,207 | 4,089,017 |
| Put Open Interest | 10,101,458 | 9,898,369 | 12,550,110 | 64,164 | 6,866,743 |
| Key Support & Resistance Strikes: |
|---|
| SPX: [4200, 4100, 4000, 3900] |
| SPY: [410, 405, 400, 390] |
| QQQ: [315, 310, 305, 300] |
| NDX:[14000, 13000, 12500, 11925] |
| SPX Combo (strike, %ile): [4162.0, 4216.0, 4113.0, 4019.0, 4023.0] |
| SPY Combo: [413.77, 419.08, 408.88, 399.49, 399.9] |
| NDX Combo: [13134.0, 12927.0] |
| Sub Login Support Follow @SpotGamma Strike Charts Historical Chart Gamma Expiration Tool |
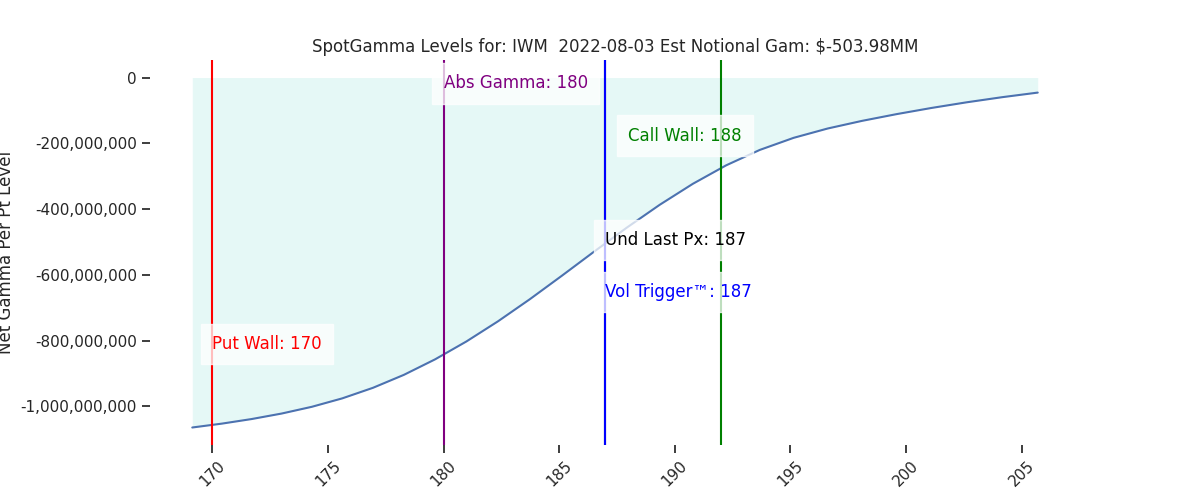
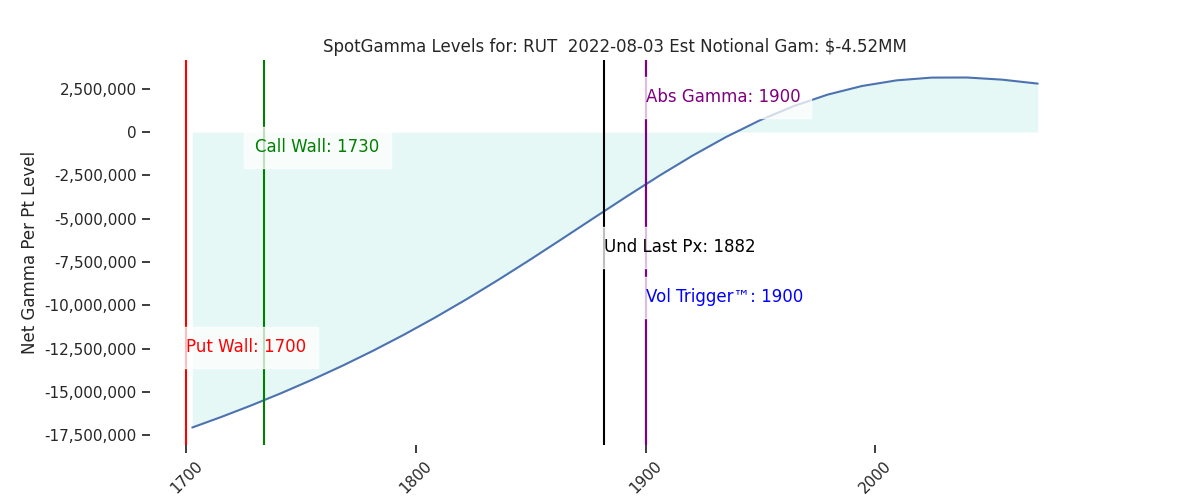
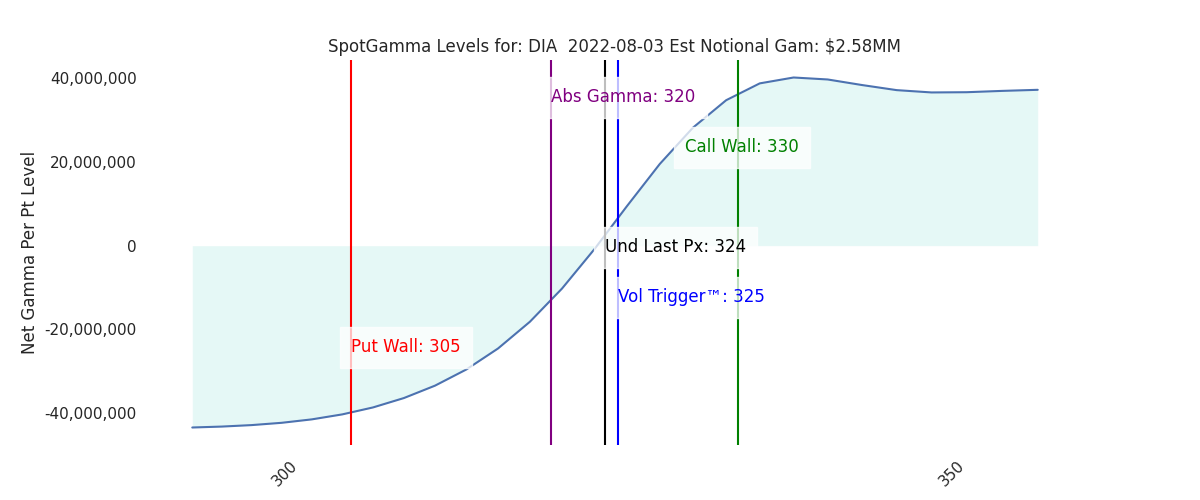
| ©TenTen Capital LLC d.b.a. SpotGamma Please leave us a review: Click Here |
| See the FAQ for more information on reading the SpotGamma graph. |
| SpotGamma provides this information for research purposes only. It is not investment advice. SpotGamma is not qualified to provide investment advice, nor does it guarantee the accuracy of the information provided. This email is intended solely for subscribers, please do not distribute the information without the express written consent of SpotGamma.com. |