Options market gamma numbers proliferate the market but its important to understand what exactly those numbers mean. Yes, positive gamma may indicate lower stock volatility. And when gamma flips from positive to negative that may indicate higher volatility. But the actual gamma number itself is an estimate of how much stock dealers will have to buy or sell for a given move in the S&P 500.
When the market is in a long gamma environment, if volume that day overwhelms the theoretical amount that dealers need to trade, it can render the gamma irrelevant. With long gamma as the market rises/declines dealers sell/buy into that move higher/lower bringing the market back to “delta neutral”. The idea is that a higher market gamma measure means that dealers have more stock to trade and will have more ability to keep the market in a range. (In a short gamma environment dealers may be trading the same direction as the market, so market volume is not as relevant.)
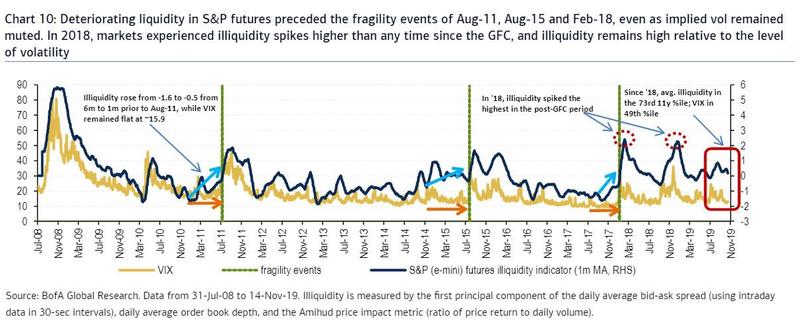
Below is a chart from BofA via ZH showing liquidity in the S&P500 emini futures. Many (if not most) market makers and large institutions would use S&P e-mini futures to hedge their books. The black line highlights “illiquidity” in the S&P futures, so a higher black line is more “illiquid”.

What makes this interesting is that we believe that futures or equity trading that is tied to options positions is one of the last, most consistent sources of active liquidity in the market. So when futures are more illiquid, we know that market makers (and other large options holders) will still have to hedge their positions and they may therefore have larger influence.
We have another post here that talks about just how much notional value is available in S&P emini futures. Also reference this $1.8bn order which caused a crash in 2016.
