We’ve written extensively about negative gamma and poor liquidity during volatile markets, and wanted to post some of those effects in real time. ZH posted an article framing how bad liquidity in ES futures is, note the chart below:
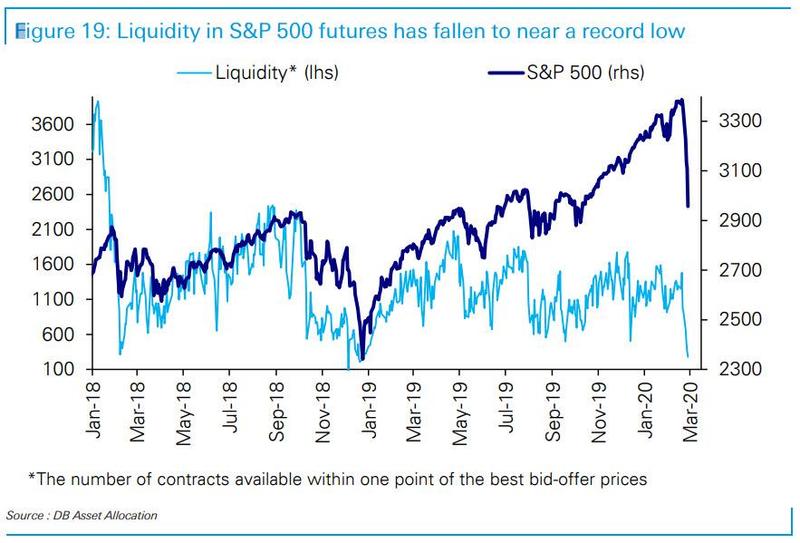
as the following chart from Deutsche Bank shows, overall liquidity for S&P500 futures has fallen to all time lows even though the S&P was trading near all time highs as recently as a week ago. As such, the recent melt up levitation was nothing more than a mirage, propelled mostly by stock buybacks among the Top 5 tech stocks and fickle retail investors, and once these were removed, the market entered the proverbial “trapdoor opening” formation. The problem is that virtually no liquidity, extreme moves to the downside are now very likely which in turn creates a reflexive relationship with risk sentiment, as the lower the liquidity and greater the selloff, the higher volatility surges leading to even lower liquidity, even more selling and so on
Zerohedge

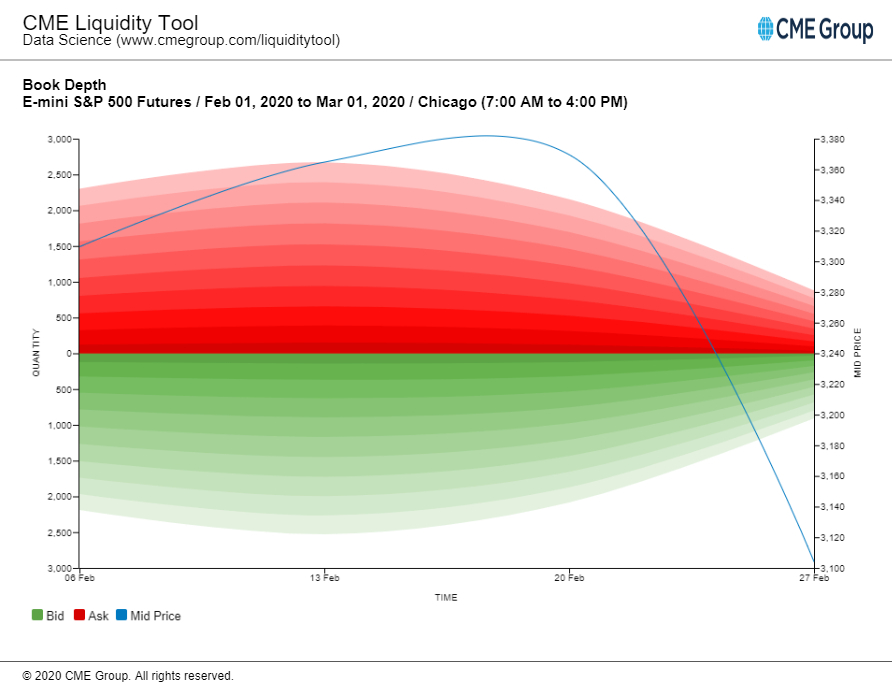
Great chart from @bigurbman shows how liquidity has changed over the month of February.

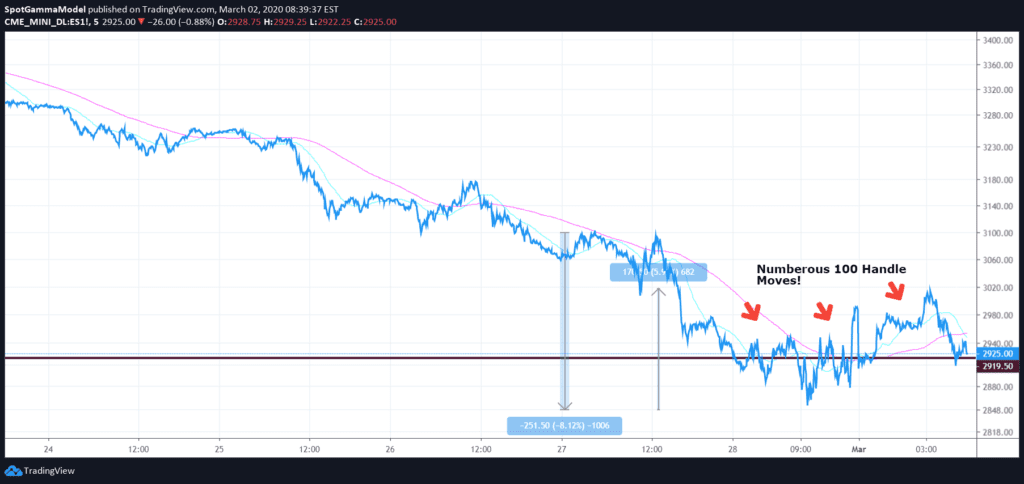
Because options dealers and other hedgers MUST hedge, they have to pay the spread to obtain the liquidity they need. In other words they have to “pay up” to fill their whole order. They generally cannot afford to let price come to them, as their options portfolio risk is too high. The result, as seen below, are extraordinarily volatile markets making multiple 100 handle moves.

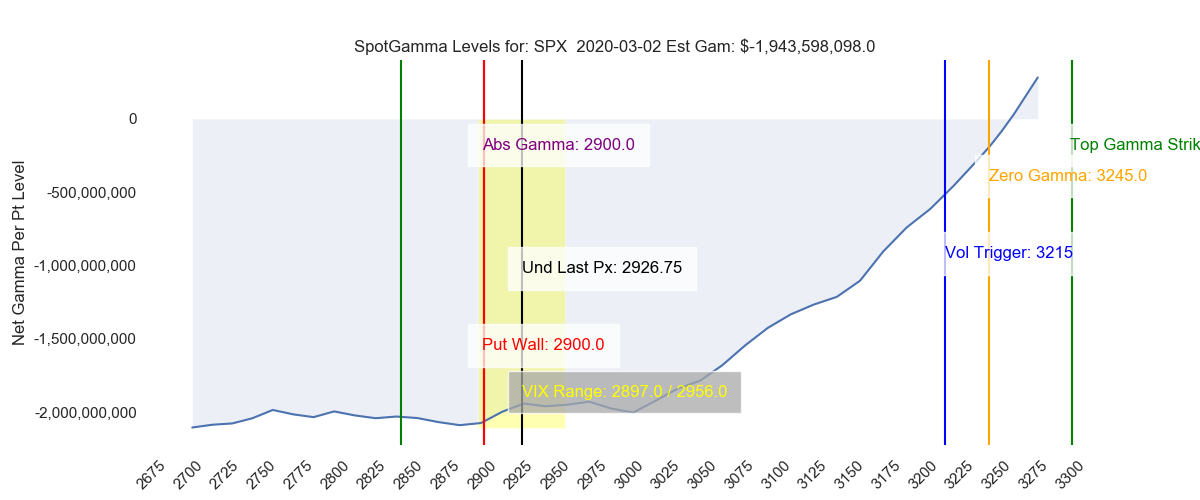
Our view is the market wont reach relative calm until we approach the zero gamma target, which is currently towards 3200 as seen below.

