• Skip to main content
  • Skip to primary sidebar

SpotGamma™

S&P 500 Stock Market Gamma Trading Levels Based on Options Open Interest

  • About
  • Pricing
  • Academy
  • Resources
    • Tool Demos
    • Case Studies
    • Blog
    • Support Center
    • Free Daily Report
    • Free Trading Tools
      • Options Profit Calculator
      • SPX Gamma Exposure
      • Implied Earnings Moves
      • Volatility Ranking
    • Free Training
    • Report Card
  • Login

futures liquidity

Aug 19 2020

Futures, Options and Liquidity.

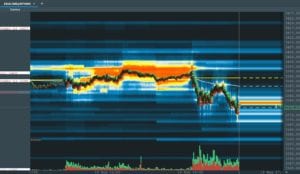
We’ve been marking 3400 as a large gamma area for several days, and you can see from our morning data that the 3400 area was again key today. Our levels are listed above, left in the Bookmap column. You can also see dark red areas in the center of the chart which denotes bid/ask liquidity, […]

Written by SpotGamma · Categorized: Market Analysis · Tagged: futures liquidity

Mar 23 2020

The Case for Reduced Price Volatility

Our current view of markets is that we should see reduced price volatility following the large March expiration that took place this past Friday (3/20). One of the features of this expiration was a large number of in the money puts, which possibly created several billion in deltas for options dealers to hedge. As dealers […]

Written by tenten · Categorized: Market Analysis · Tagged: delta, ES futures, futures liquidity, futures volume, JPM, volatility

Mar 02 2020

Poor Liquidity & Negative Gamma: Volatile Stuff
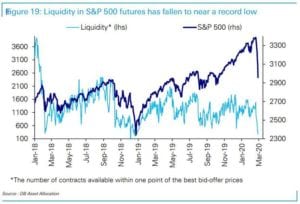
We’ve written extensively about negative gamma and poor liquidity during volatile markets, and wanted to post some of those effects in real time. ZH posted an article framing how bad liquidity in ES futures is, note the chart below: as the following chart from Deutsche Bank shows, overall liquidity for S&P500 futures has fallen to all […]

Written by tenten · Categorized: Market Analysis · Tagged: CME, futures liquidity, gamma trap, negative gamma

Aug 19 2019

JPM Liquidity Rates & VIX Correlation

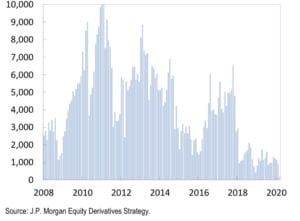
JPM says that liquidity disappears as VIX spikes. This seems to make intuitive sense. The fact that the VIX is higher means the market is pricing in larger moves which means dealers don’t want to get stuffed with large trades as the market rips through them. This chart doesn’t tell us what level this depth […]

Written by SpotGamma · Categorized: Market Analysis · Tagged: futures liquidity, gamma, JPM, VIX

Primary Sidebar

SpotGamma-Subscriber-Signup-Banner

  • Software Earnings Reignite Risk Appetite
  • Jackson Hole 2026: What the Options Market Expects
  • One Stock, 803 ETFs: Why Nvidia Earnings Impacts the Entire S&P 500
  • NVDA Earnings: The Options Market May Be Underpricing This Move
  • Volatility Has Compressed. What Happens Next?
  • youtube
  • x
  • Privacy Policy
  • Disclaimer
  • Terms & Conditions
  • Support Center
  • Media
  • Contact Us

©2026 TenTen Capital LLC DBA SpotGamma

All SpotGamma materials, information, and presentations are for educational purposes only and should not be considered specific investment advice nor recommendations. Futures, foreign currency and options trading contains substantial risk and is not for every investor. An investor could potentially lose all or more than the initial investment. Risk capital is money that can be lost without jeopardizing one's financial security or lifestyle. Only risk capital should be used for trading and only those with sufficient risk capital should consider trading. Past performance is not necessarily indicative of future results. Testimonials appearing on this website may not be representative of other clients or customers and is not a guarantee of future performance or success.

View Full Risk Disclosure