CME posted an interesting analysis called “Alternative Liquidity Measures” about volumes and depth of book. Their view is that liquidity doesn’t disappear during crisis times. The central argument is something along the lines of: “How can liquidity be worse if volumes skyrocket during market drops?” And that is actually a solid point. Yeah, you can get a fill. Its just not at a good price. When volatility picks up markets widen as risk rises and traders are pushed to become more aggressive if they want an order to get filled. If you think the market is going to drop 2% in the next few minutes you’re more willing to pay the spread to get your order filled.
This brings up a few points in relation to hedging activity. First, during negative gamma scenarios you have hedging activity that is going in the same direction as the market. If the market is heading lower you in theory have market makers selling, too. They may be less price sensitive than other market participants and are selling into a market that has lower “liquidity quality”. That hedging activity may cause more price impact/market movement. Said another way they cause more volatility during negative gamma situations because the liquidity they need is available, but only at lower and lower prices.
The chart below shows depth of book data over various months, for various periods of the day. You can see how depth of book size collapsed during the Dec ’18 crash (red arrows). The highlighted yellow periods (open and close) are the highest volume periods of the day (see VWAP). We think the most important periods of hedging for market makers would be the open and close as they need to adjust back to delta neutral before/after the overnight session. You can see in those open/close periods just how much depth of book (aka liquidity quality) dried up.
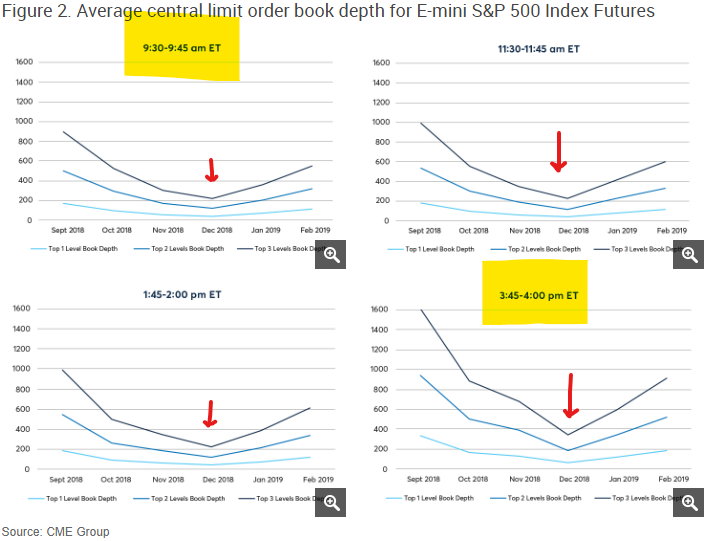
If you look at the market during positive gamma environments (Sep ’18) there is ample depth of book liquidity. This means that any given participant should have less market impact. This can help to explain why there is such a correlation between gamma levels and stock market volatility (see here). There certainly appears to be a link: positive gamma environments have ample depth of book, negative gamma environments have much lower levels of depth.
Here’s the CME’s conclusions:
Traditional indicators of liquidity such as order book depth and price dispersion, if taken in isolation, point to the fact the market was less liquid in December 2018 than in September. However, for 90% of the time during the US trading day this increase of price dispersion was no more than approximately 1.5 ticks (or 0.375 index points… in relation to E-mini S&P 500 futures trading at prices in the range of 2350 – 2950 during this period, or approximately 1.5 basis point) while the market accommodated approximately twice the trading volume.
CME
As pointed out in figure 1, the book depth appeared to have decreased by 75% in the same period while the trading volume doubled. While the fill quality degraded to some extent, it is also hard to argue that the market was “illiquid” in some absolute sense. There is more to liquidity measurement than just the average book depth.
Check out our subscription for daily options levels and market gamma analysis.