• Skip to main content
  • Skip to primary sidebar

SpotGamma™

S&P 500 Stock Market Gamma Trading Levels Based on Options Open Interest

  • About
  • Pricing
  • Academy
  • Resources
    • Tool Demos
    • Case Studies
    • Blog
    • Support Center
    • Free Daily Report
    • Free Trading Tools
      • Options Profit Calculator
      • SPX Gamma Exposure
      • Implied Earnings Moves
      • Volatility Ranking
    • Free Training
    • Report Card
  • Login

Apr 29 2020

Pre Fed Dealer Gamma Charts

We note to subscribers today that the market is at a key “gamma crossroads” around 2900 where we see sustained positive gamma above that level and the possibility of a strong move into negative gamma if the Fed disappoints today. For the past week we have been consolidating around the zero gamma level and options volumes have been waning. The Fed & FOMC decision today should break this market gamma stalemate. Below you will find gamma charts and commentary from Nomura and Morgan Stanley.
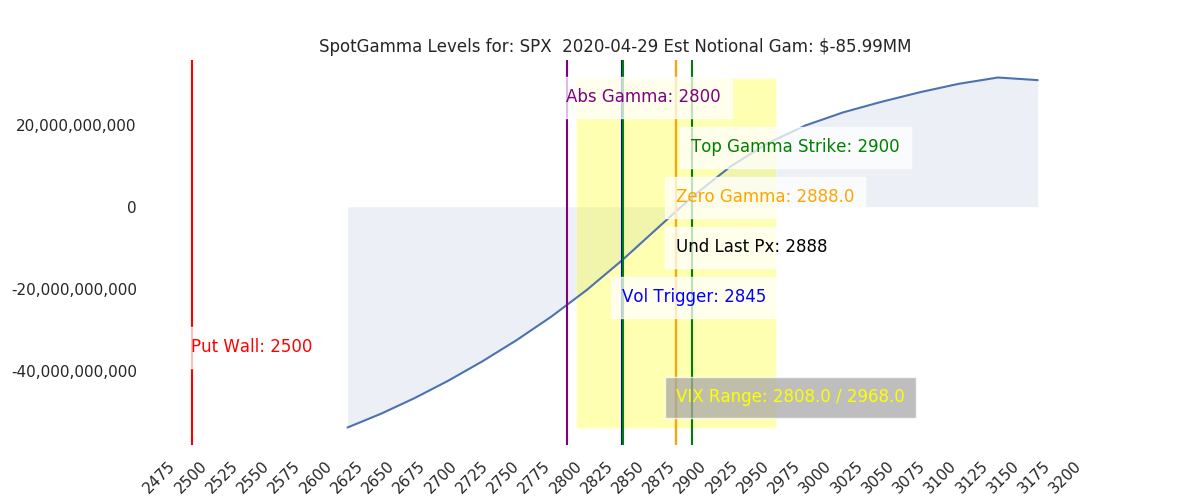
SpotGamma SPX Market Gamma Chart

From ZeroHedge:

the Nomura strategist notes “the return of heavy overwriter (vol selling) flows in US Equities, a trend that has accelerated in recent weeks, and has helped normalize US Equities single name- and index- Vols”, and now, with the VIX curve term-structure too normalizing yesterday from the multi-month inversion in the front-end (i.e. again upwardly-sloping), Charlie believes that “it is likely that the return of systematic roll-down participants will further escalate the repricing / compression of Vol even lower.”

Focusing on the last point of normalizing/compressing Vol, something which McElligott has previously called a “Crash DOWN, Crash UP” cycle, he points out that “it matters as a second-order slingshot in dictating a mechanical RE-LEVERAGING across the Vol Target universe into re-establishing or growing their Equities positions.”

There is no clearer example of this than today’s Nomura QIS CTA Model, which estimates that the CTA position in S&P 500 futs would flip from “-69% Short” to a “+100% Long” on the close above 2901 (right on top of spot), with Charlie adding “that anecdotally on these days where the model indicates a “flip” potential, said buying to cover and go long is likely already part of the flow creating the current move (ES1 +1.2%)“

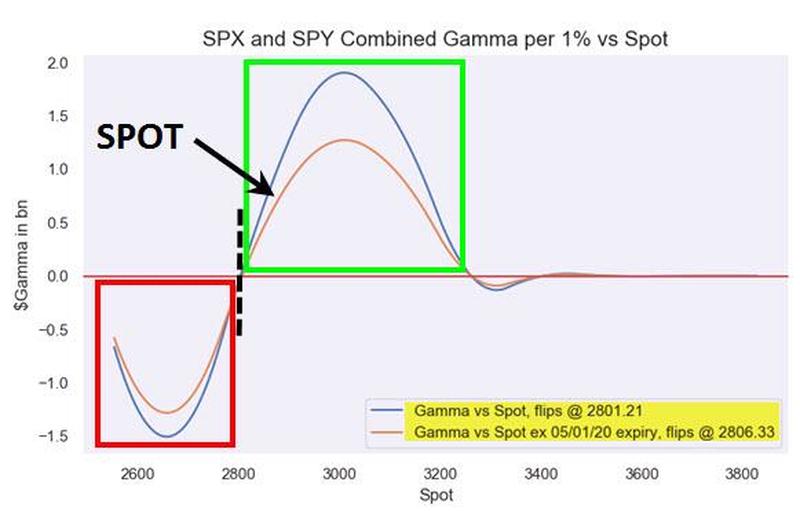
Nomura Market Gamma Chart April 2020

From Marketear:

The “gamma flip”-“Based on recent flow QDS estimates SPX dealer gamma would flip to negative above 2880, which could add further upside momentum to an already frothy market if crossed.” Just as we wrote earlier on marketear, recent implosion in vols, makes especially gamma look cheap. The “rational” investor should look at replacing longs with calls, or playing the upside via cheap optionality. So, if the rational investor buys (or protects shorts or whatever strategy they might have where they end up buying upside calls) upside calls, the dealer (market maker) will become short options. Unless the dealer hedges with options, the need for buying delta (stocks or futures) will spike as we move closer to the 2880 level and time passes. Gamma explodes as we near maturity. Depending on how market makers decide to hedge (delta or options hedging) moves could get magnified as we reach the 2880 level.

marketear
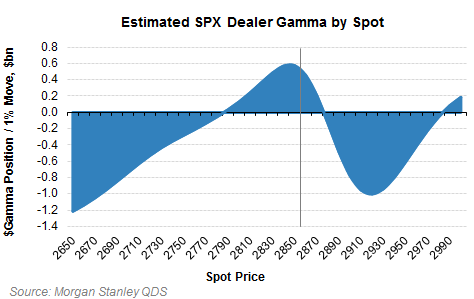
Morgan Stanley SPX Stock Market Gamma

If you liked this analysis, try out a subscription and get a free 5 day trial.

Share This Article

  • Share
  • Twitter
  • LinkedIn
  • Reddit
  • Facebook

Written by tenten · Categorized: Market Analysis · Tagged: market gamma, morgan stanley, nomura, zero gamma

Don’t have an account with SpotGamma?

Choose the plan you want today to view unique support and resistance levels, access Founder’s Notes and expert commentary, daily trading ranges, and entrance into our private Discord.


Primary Sidebar

Related Resources

  • Options Exchange Monitor — Week of August 15, 2026 (36 SEC notices, 2 CFTC, 0 EDGAR)

    Options Exchange Monitor — Week of August 15, 2026 (36 SEC notices, 2 CFTC, 0 EDGAR)

    August 17, 2026
  • GEX Levels for SPY, QQQ, ES and NQ: Using Index Gamma in Any Product

    GEX Levels for SPY, QQQ, ES and NQ: Using Index Gamma in Any Product

    August 17, 2026
  • How to Trade GEX Levels: A Practical Guide to Gamma-Based Trading

    How to Trade GEX Levels: A Practical Guide to Gamma-Based Trading

    August 17, 2026
  • Free GEX Levels, Charts, and Data: What’s Available and What It’s Actually Worth

    Free GEX Levels, Charts, and Data: What’s Available and What It’s Actually Worth

    August 17, 2026
  • Covered Calls After Assignment: What to Do When the Stock Drops Below Your Cost Basis

    Covered Calls After Assignment: What to Do When the Stock Drops Below Your Cost Basis

    August 17, 2026
  • youtube
  • x
  • Privacy Policy
  • Disclaimer
  • Terms & Conditions
  • Support Center
  • Media
  • Contact Us

©2026 TenTen Capital LLC DBA SpotGamma

All SpotGamma materials, information, and presentations are for educational purposes only and should not be considered specific investment advice nor recommendations. Futures, foreign currency and options trading contains substantial risk and is not for every investor. An investor could potentially lose all or more than the initial investment. Risk capital is money that can be lost without jeopardizing one's financial security or lifestyle. Only risk capital should be used for trading and only those with sufficient risk capital should consider trading. Past performance is not necessarily indicative of future results. Testimonials appearing on this website may not be representative of other clients or customers and is not a guarantee of future performance or success.

View Full Risk Disclosure