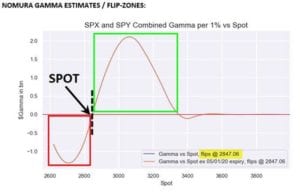
We produced these levels in real time for subscribers, but if you’re a bit behind here is the update from Nomura via ZH. This note comes after the SPX tested 2950, and sold off toward the 2800 level on Friday 5/1/20. The gap also shocked the also just-established Dealer “Long Gamma” position (when ref was […]
market gamma
Pre Fed Dealer Gamma Charts
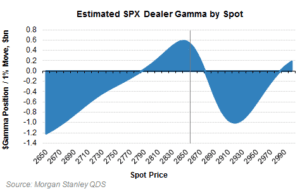
We note to subscribers today that the market is at a key “gamma crossroads” around 2900 where we see sustained positive gamma above that level and the possibility of a strong move into negative gamma if the Fed disappoints today. For the past week we have been consolidating around the zero gamma level and options […]
Nomura Gamma Update 1/22/20
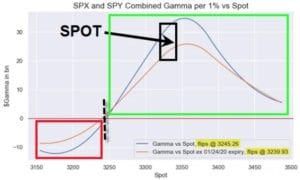
Heisenberg posted an updated gamma note from Nomura, and we like to note them here versus SpotGamma data. Nomura posts a combined SPX/SPY figure whereas we break the data out. The note and charts sync with much of what we have been saying: That long gamma is still in control. Last week, Charlie noted that […]
Possible Gamma Flip Setup 1/7/2020
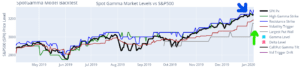
We’ve been tracking very high levels of call gamma the last several weeks that has recently stalled as we’ve hit heavy resistance around 3250 (blue arrow in chart below). During the last several days the zero gamma flip point has moved higher to ~3185 as you can see (green arrow): Iran has started launching missiles, […]
Expiration Is About Deltas
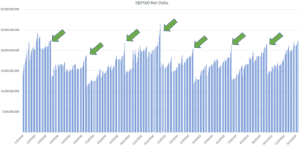
Much talk focuses on options market gamma and changes in gamma around expiration. But what may be the real catalyst around OPEX is a change in deltas, not gammas. When options expiration occurs (especially a large one like December) options are closed, expire or rolled. You therefore can have large positions change, which can cause […]
Nomuras Gamma Model 12/23/19
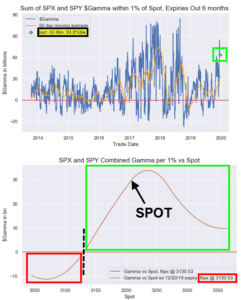
We like to post Nomuras model snapshot here to compare against ours. Our volatility neutral indicator is lower, but the top matches. Some of this may be explained by Nomura combining SPY and SPX.
Nomura’s McElligott Explains The ‘Perfect Virtuous Feedback Loop’ As Gamma Gravity Pins Equities “Intraday movement is squelched”.
From Heisenberg a great note from Nomura which syncs with what we wrote in recent weeks and to our subscribers. “Price movements over this summer once again clearly emphasized the spot/gamma/realized vol dynamics”, SocGen wrote, in a September note documenting a crucial dynamic that can always be described as “underappreciated” until everyone understands it. “All […]
Why Track Gamma, Not Delta?
This question of why we track gamma and not delta comes up fairly often. (For those needed a level one primer on delta vs gamma go here: OptionsPlaybook. If you need a primer on options market makers check here.) Our belief is that when options market makers (MM’s) start and end each day delta neutral. […]
Gamma Market From 8/16/19
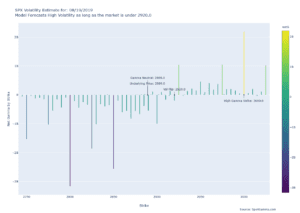
Volatility will continue to reign until (if) the market recaptures 2920. There is a ton of fuel ready to burn and one headline (or tweet) will send the market flying. The only recommendation that is safe here is to not sell any options, being short volatility is very dangerous here, as a >3% rally is […]
SpotGamma Trading Levels Vs Nomura
Here is a report from Nomura compared to the same days market forecast from SpotGamma.com. Notice the “zero gamma” levels are the same in both reports at 2935 in the S&P500. We call the “zero gamma” level “volatility trigger”. Using this level can help forecast the level of stock market volatility. Under this market price […]