Below are a few charts that we’ve been watching as we’re in the midst of the Crash of Feb 2020. Several indicators are showing extreme readings and we wanted to chronicle those. If you have one you think we should add email us: sg@spotgamma.com.
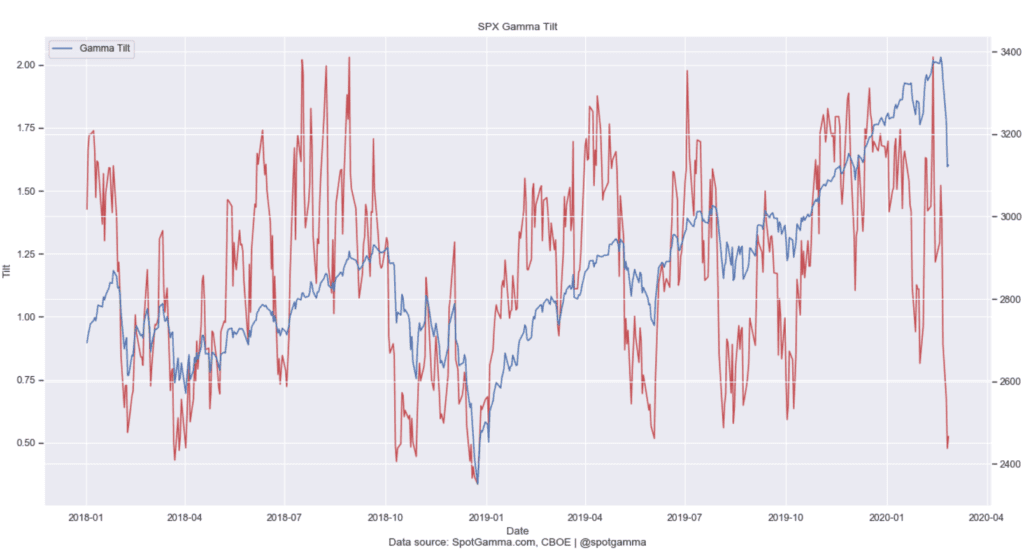
One of the things we look at “Gamma Tilt” which is a measurement of call gamma:put gamma. You can see it is approaching the lows of 2018. The updated chart is available to subscribers.
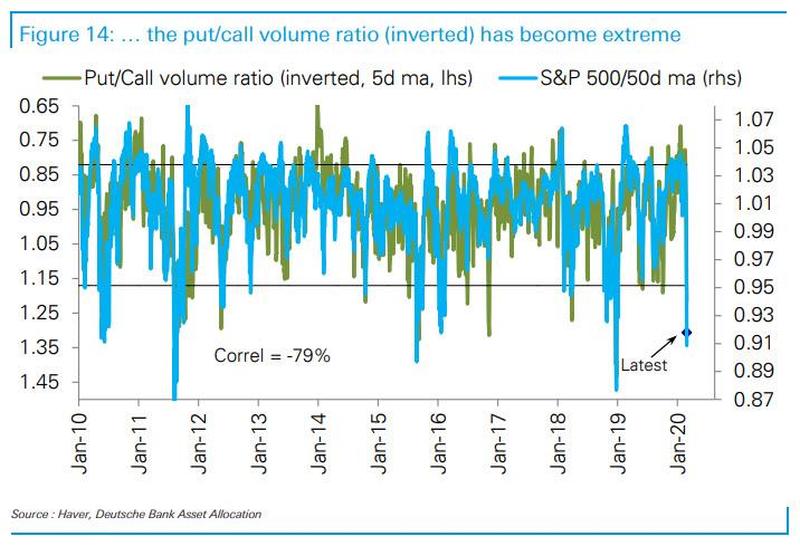
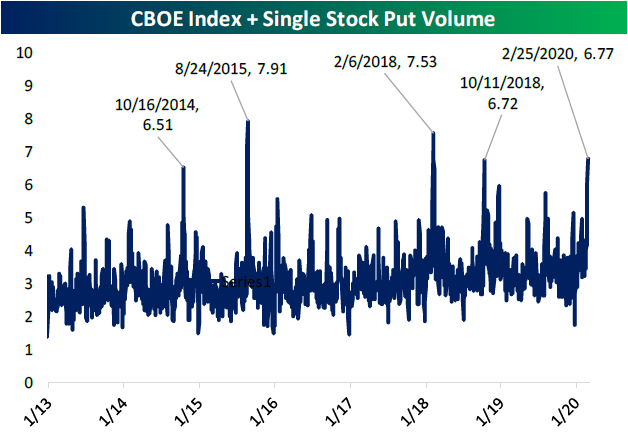
Bespoke Invest: Put volumes today (2/25) were the highest since February 6th, 2018 (during the period when the volatility markets blew up thanks to the VIX).
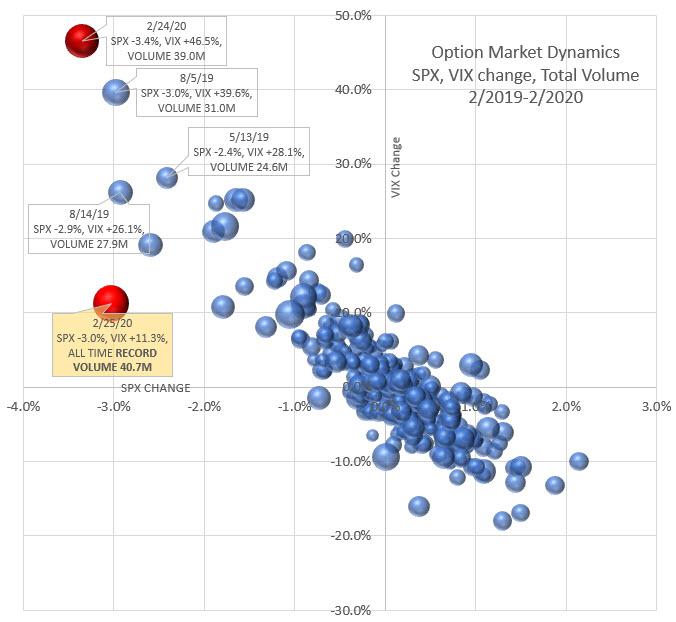
Trade Alert LLC: New all-time option volume record deserves a new post! 40.7M contracts today blows away the prior record set in 2011 and exceeds the total contract volume for the entire year of 1977 by 3M contracts. Was interesting is that the VIX hadnt really broken out on this day (25th) it was 2 days later that VIX spiked.
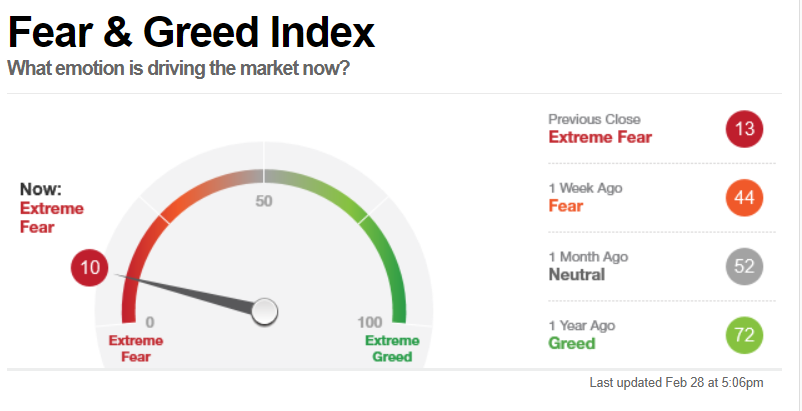
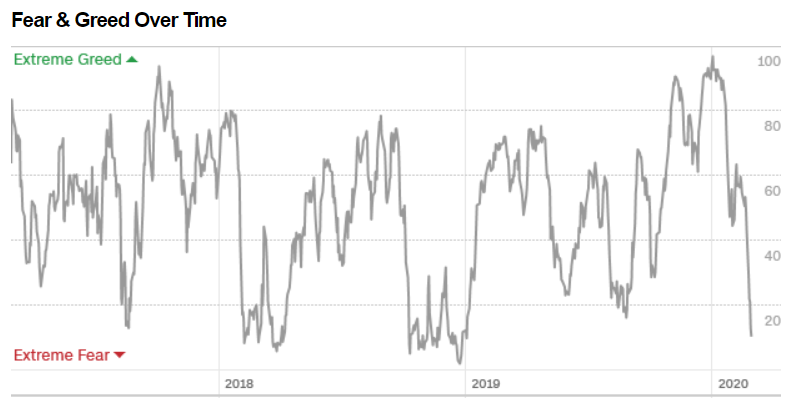
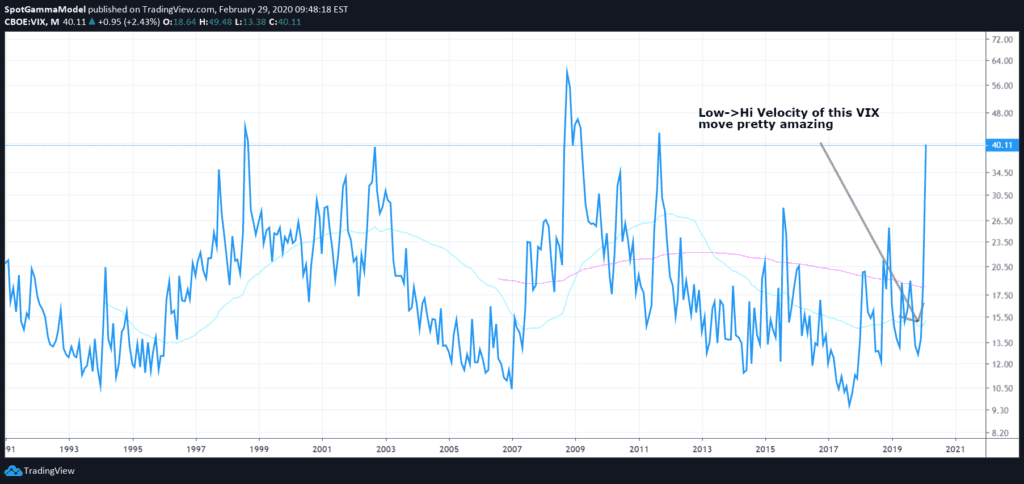
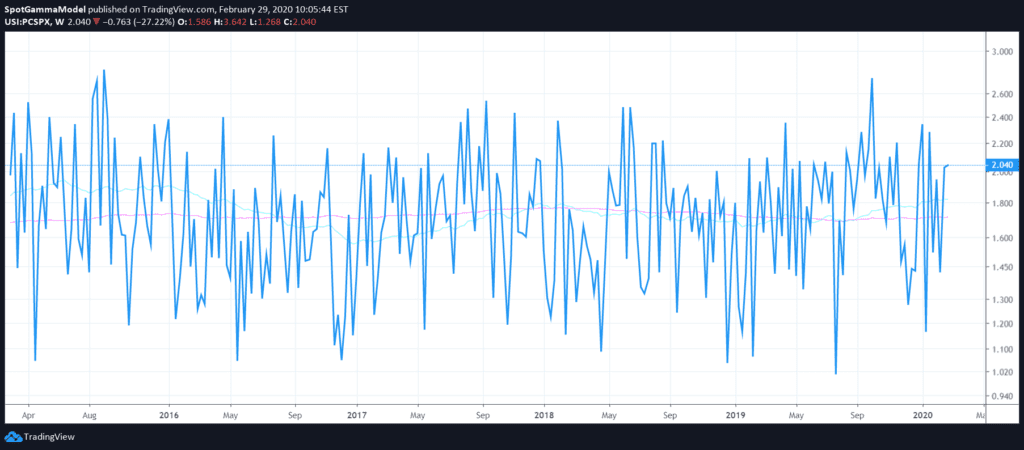
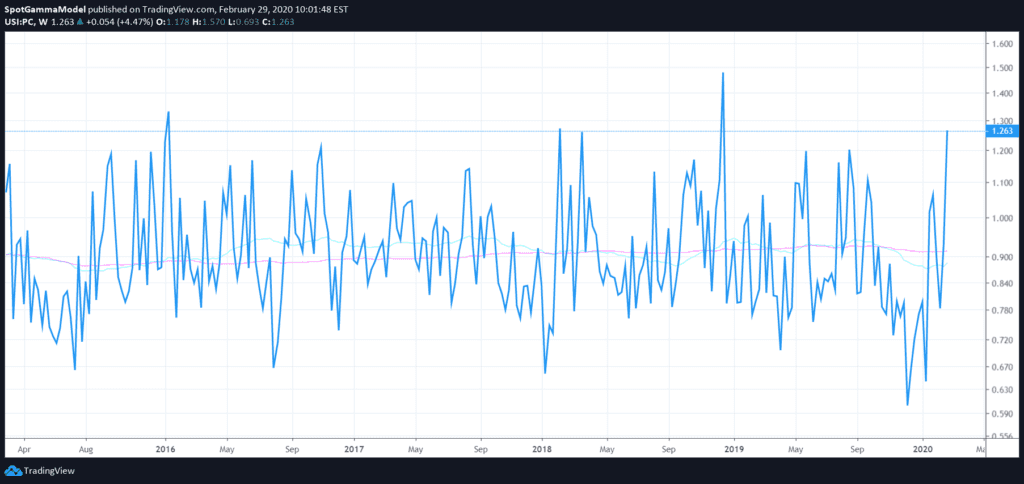
I’ve looked through various Put Call ratios, most of them seem like just noise. The SPX PC ratio for example is here, but the composite PC (2nd chart below) seems to pick up “fear”.
S&P 500: 3% of stocks closed above their 50-day moving avg, lower than 99% of historical readings.
— Charlie Bilello (@charliebilello) February 29, 2020
Only periods with fewer % (data back to Dec ’01)…
July 2002
Oct/Nov 2008
Dec 2018 pic.twitter.com/hDM2XV85Xb
#StockMarket
— Tiho Brkan (@TihoBrkan) March 1, 2020
1/ Major stock regions suffered a crash this week.
The US market failed to warn us the uptrend was ending (usually with a lower high).
International markets did & it was one of the reasons we reduced our exposure on Wed 19th of Feb.https://t.co/20TLX2v80Z pic.twitter.com/Liqx6RLqyZ
This looks oddly familiar…$NDX pic.twitter.com/dCmbzrv3ub
— Sven Henrich (@NorthmanTrader) February 1, 2020
