The following is a guest post courtesy of Michael Kramer of Mott Capital Management.
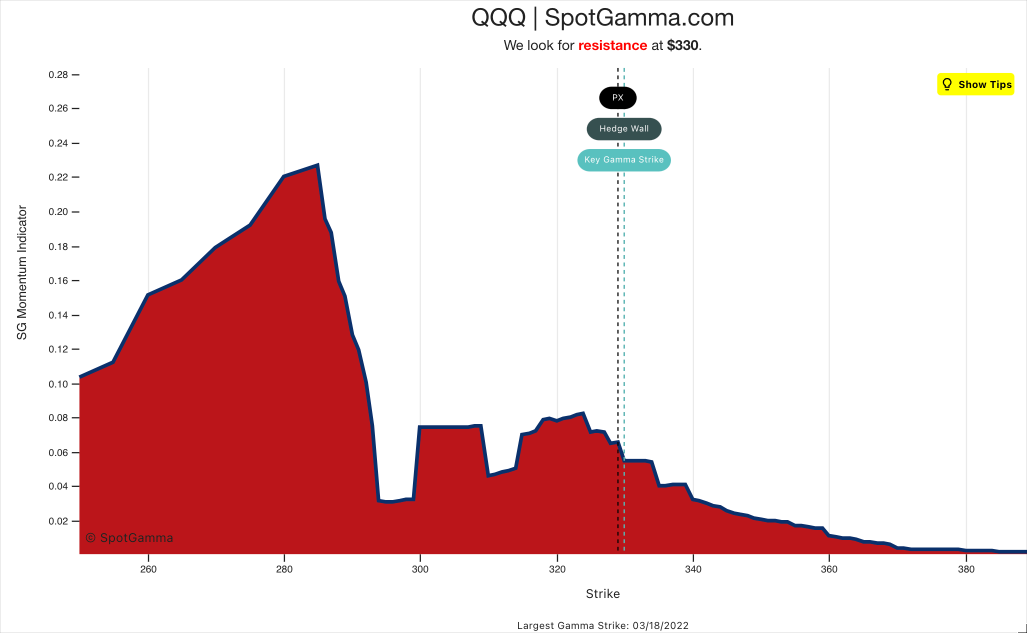
With the Fed pivoting to a very hawkish stance starting in 2022, the Nasdaq has witnessed a dramatic decline of nearly 18% since peaking in November. The drop may only continue in the weeks ahead as market participants try to figure out the potential path of Fed rate hikes and how many may be in store. This does not bode well for the Nasdaq 100 ETF (QQQ) as the SpotGamma Equity Hub model shows the most significant amount of gamma sits well below $300 currently for the ETF.
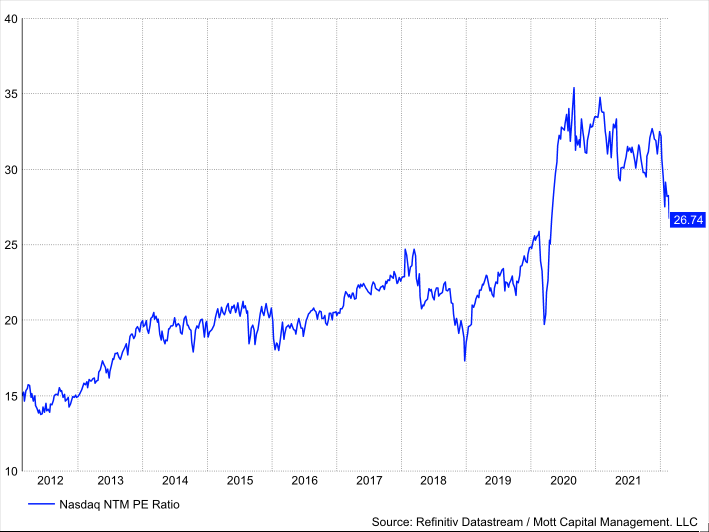
The pivot by the Fed is causing yields to rise across the curve, resulting in investors thinking about fundamentals and how much they pay for future earnings and sales. The higher rates climb, the more downward pressure it puts on the present value of those earnings and a stock’s value. This has led to the PE ratio for the NASDAQ to decline in recent weeks.
As if that weren’t enough, the Russian invasion of Ukraine has added another layer of risk and uncertainty to the market, creating massive amounts of intraday volatility, as witnessed on February 24. It has even prompted some investors to think the Fed may ease back on its rate-hiking outlook.
Valuations Matter
With all these events, it seems that valuations matter again. Even with the declines, the PE ratio for the Nasdaq and many of its components are still very high. As rates rise and expectations for Fed rate hikes get priced in, it is possible that the PE ratio contracts further. Even back towards something more historically appropriate given the rising rate environment, which could be pretty significant.
A Gamma Void
From a gamma perspective, the Equity Hub model shows that a significant concentration of gamma lives much lower for the QQQ ETF than its current price. The model shows that most of the substantial gamma is below $300 and closer to $295. Suggesting that if the ETF starts pushing lower, from an options perspective, there isn’t likely to be very much support for the ETF or the market in general. That would be a massive drop from its closing price of around $340 on February 24.
Technically Weak Structure
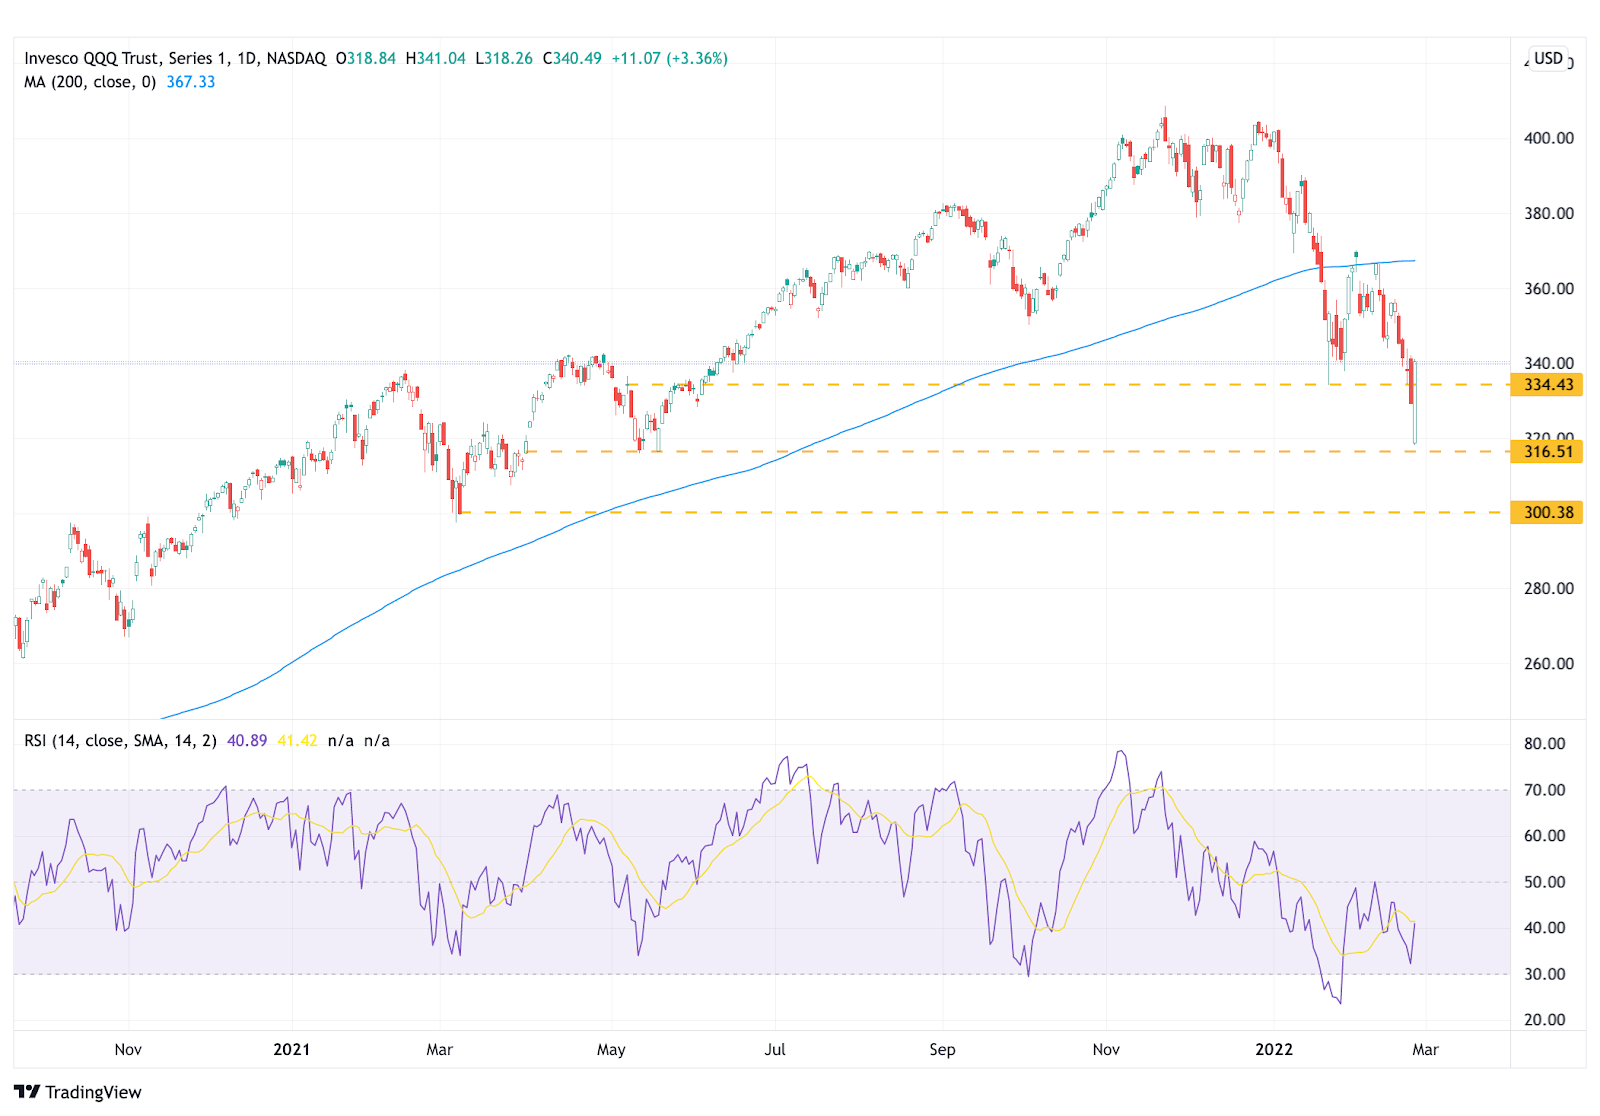
Even from a technical perspective, the risk is high for a significant pullback if the critical levels of support get broken. For now, that considerable level of support on the QQQ ETF comes around $334, which is currently holding. Given the fragile and bearish momentum indicated by the relative strength index, that support may not hold up for much longer. That price was tested briefly on February 24, but it snapped back quickly. Should $334 break, the next support level does not come until $315. After that, there is very little support until approximately $300, falling in line with the gamma model’s reading mentioned above.
Not Doomed to Fail
It is not to say that the Nasdaq 100 is doomed to see lower prices. But it does give one a sense that presently the underlying structure of the market may not be favorable at this point and is weak. However, the gamma levels may start to build back up at higher levels, resulting in the ETF finding some form of stability in the days ahead and even holding support around $334. Should support hold, it could result in the QQQ all the way back to $357.
But given all the volatility in the market, it may be worth paying particular attention to all these levels, whether higher or lower, in the days to come, especially with the significant headline risk that has developed over the past week.