• Skip to content
  • Skip to primary sidebar

Spot Gamma

S&P 500 Stock Market Gamma Trading Levels Based on Options Open Interest

  • Subscribe Now
    • Why Gamma
  • Backtest
  • OPEX Tables
    • Options Data Tables for SPY
  • Market Analysis
  • About
    • FAQ
    • Disclaimer
    • Contact

Dec 05 2019

SocGen Zero Gamma Chart History

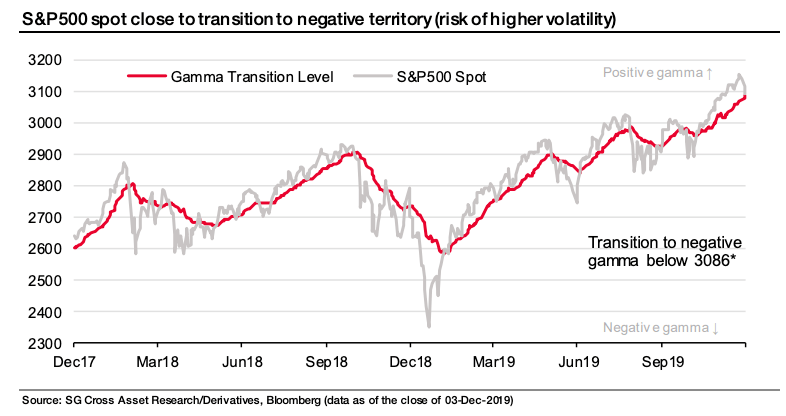
Here is a backtest of where SocGen calculates where positive gamma changes to negative gamma in the S&P500 (SPY). You can view our historical chart here. The concern is that a move through the zero gamma level may set a “gamma trap“.

SocGen Back history of SPX & SPY Market Gamma

Our FAQ has more information:

Zero Gamma Level: This is the estimated level at which dealers flip from “long gamma” to “short gamma”. Think of this indicator as the S&P500 level at which volatility shifts from low to high. When the market is above the indicator value traders and investors are more likely to see lower volatility markets due to the options dealers long gamma position . Below the indicator we an anticipate rapid, out-sized moves because dealers are short gamma. The volatility level indicator adjusts daily. Here is an analysis of markets moving through the volatility trigger.

Subscribers receive the zero gamma level to their email inboxes daily.

Share this:

  • Twitter
  • Facebook
  • LinkedIn
  • Reddit

Written by Spot Gamma · Categorized: Market Analysis · Tagged: chart, gamma trap, history, socgen, zero gamma

Primary Sidebar

Listen to SG on:

Market Huddle Podcast
Follow @spotgamma

Sign up for SpotGamma.com


powered by MailChimp!

Recent Market Commentary

  • SpotGamma Report for: 02/05/2020, 21:33
  • SpotGamma Report for: 02/05/2020, AM
  • SpotGamma Report for: 02/04/2020, PM
  • SpotGamma Report for: 02/04/2020, AM
  • SpotGamma Report for: 02/03/2020, PM
  • Disclaimer

Copyright © 2020 · Altitude Pro on Genesis Framework · WordPress · Log in