The following is a guest post courtesy of Michael Kramer of Mott Capital Management.
On November 12, I warned that dreams of a seasonal run higher were in doubt and that an end-of-year melt-up could quickly turn into a meltdown. It seems that instead of stocks cruising into the end of the year, they have been hit by the turbulence I projected in my last note, as the market is now contemplating a much faster Fed tapering pace. This has resulted in credit spreads widening and volatility surging, which led to stock prices crumbling… and it could still get much worse.
The SpotGamma Equity Hub model shows that the options market could create a very fast drawdown in the S&P 500 over the next couple of weeks, with the S&P 500 potentially dropping an additional 10% to 4,100 before year-end.
There is Potential for a Fast Drop
The SpotGamma Equity Hub shows that the S&P 500 ETF (SPY) gamma positioning is solid, around $450. However, if that support level is breached, the SPY and index could quickly drop to $440. Then, if $440 on the SPY cannot hold, the gamma model shows a virtually straight drop with no significant support from the options market until $410.

Risk-On Is Fading
It should come as no surprise that the equity market has suddenly put on the breaks and is now in full reverse mode. The warning signs have been there for several weeks. Risk-taking was on the brink of breaking down in the middle of November, and now it has collapsed as the Fed has indicated it may accelerate its tapering pace.
One relationship I watch in the currency space is the Australian Dollar – Japanese Yen currency ratio, which has reverted to its late September lows. This currency pair has traded in line with the S&P 500 for nearly two years, and more recently, has been acting as a leading indicator for the S&P 500, and the considerable divergence is notable.

Trouble In Bonds
Additionally, the yield curve has fallen even further since the middle of November. Over that time, the curve has flattened from 1.12% on November 16 to just 75 bps on December 3rd. This is a signal that the bond market sees an accelerated Fed taper slowing economic growth, and if the spread flattens enough, it could serve as a warning sign of a potential recession.
Finally, credit spreads widened dramatically, the week ending December 3 with the ratios like the iShares 20+ Year Treasury Bond ETF (TLT) to iShares iBoxx High Yield Corporate Bond ETF (HYG) rising to 1.79, its highest level since January 2021. The higher this ratio gets, the more the stress bonds are feeling. This also appears to be sending a warning message to the equity market, as the VIX index has jumped recently, following these widening spreads. The VIX may rise further if this bond spreads widen more, as the VIX and these credit spreads have been positively correlated in the past.
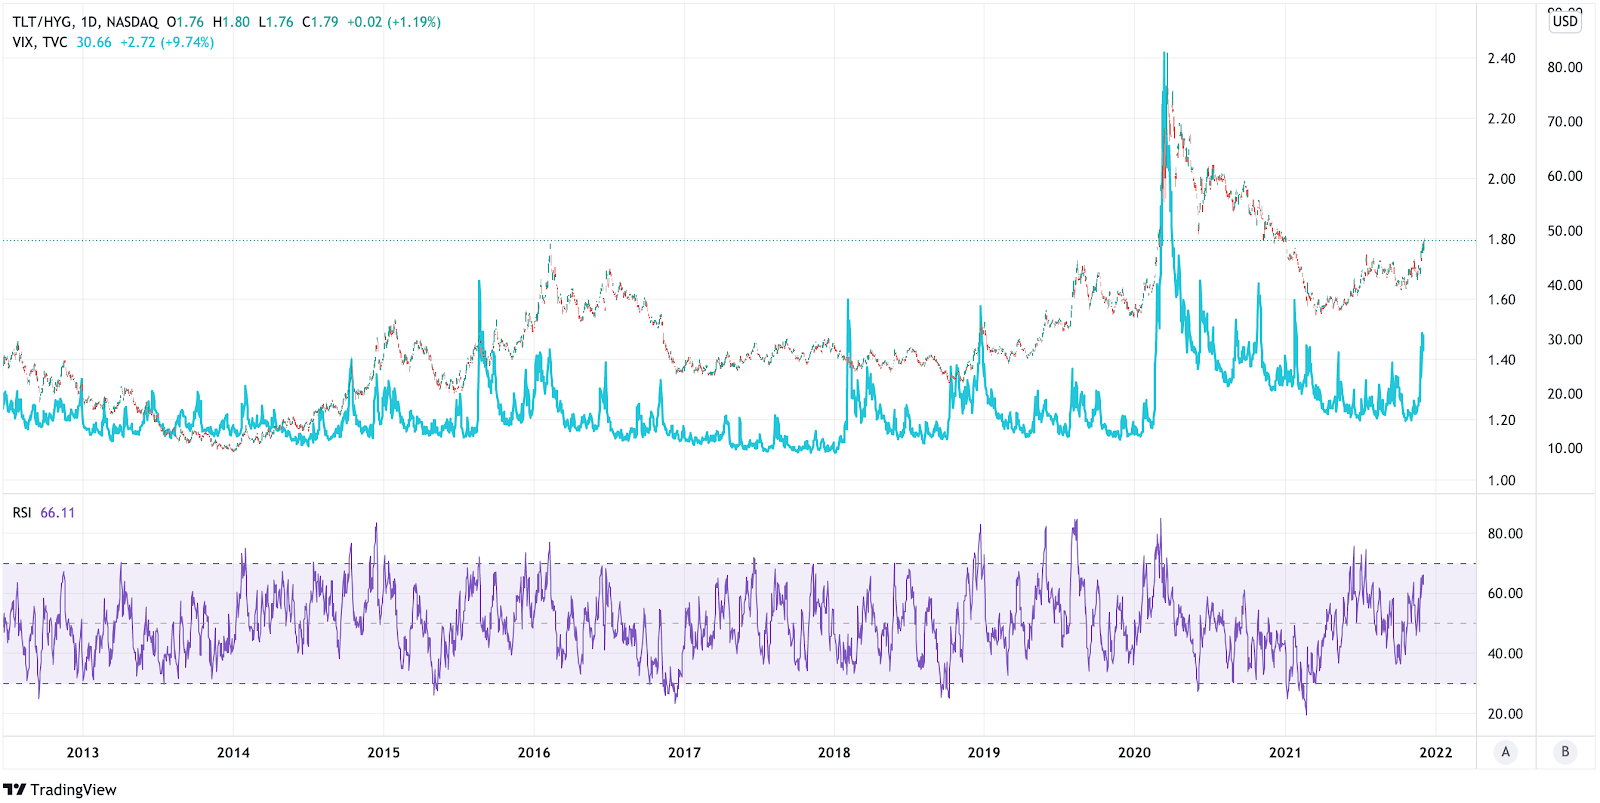
In summary, while we are currently range bound from a technical perspective, the macro backdrop to support the equity market appears to be deteriorating quickly. The Fed has rapidly shifted the market’s expectations from one of potential complacency to one of a faster taper over the past week. If investor expectations continue to follow this path, it seems highly likely that the recent downdraft in stock prices could only be the beginning.
DISCOLSURE: Michael Kramer Owns SPY Puts
Mott Capital Management, LLC is a registered investment adviser. Information presented is for educational purposes only and does not intend to make an offer or solicitation for the sale or purchase of any specific securities, investments, or investment strategies. Investments involve risk and, unless otherwise stated, are not guaranteed. Be sure to first consult with a qualified financial adviser and/or tax professional before implementing any strategy discussed herein. Past performance is not indicative of future results.