The following is a guest post courtesy of Michael Kramer of Mott Capital Management.
Investors have watched the S&P 500 rise by as much as 10% since the October 4 lows, while the NASDAQ 100 has increased by 14.5%. It has left many investors dreaming about an end-of-year melt-up for equities due to seasonal factors and the fear of missing out. I’m here to tell you not to count on it. Several warning signs are going on undetected by the masses, which suggest a melt-down may be about to happen.
SpotGamma Equity Hub lays the risks out very clearly, and it may only take a tiny push to get the indices moving down and by quite a significant amount before year-end. Even worse, all those ingredients are in place for that push to happen at any time.
Risk-Taking
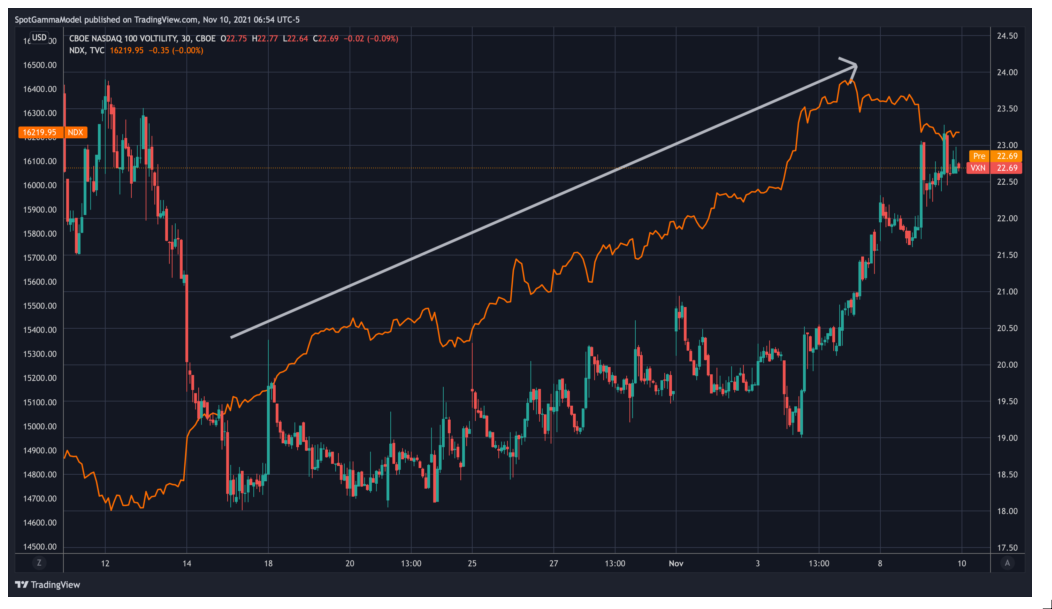
Risk-taking is easily the first essential ingredient, and it has reached worrisome levels. As recently noted in the SpotGamma Founder’s Notes, the Nasdaq 100 and the Nasdaq 100 volatility index (VXN) have both been rising steadily since the middle of October. They noted that type of activity is often a sign of excessive exuberance as traders bid up the price of calls. Something similar happened, leading up to the significant declines of September 2020.
A Flattening Yield Curve
Additionally, less easily detectable indicators do not support rising stock prices, such as the flattening yield curve. The curve flattens when short-maturity rates and long-maturity rates move in opposite directions. In this case, the short-end of the curve is rising due to Fed tapering and the prospects for Fed rate hikes. At the same time, the longer-end of the curve is falling as the market worries about longer-term growth slowing. Overall, a flatter curve would suggest a weak economic outlook, possibly because the Fed tightens sooner than expected, crippling the economy. If the bond market worries prove to be correct, it would be a big negative for the reflation sectors of the stock market, such as financials, materials, industrials, and discretionaries.
Global Concerns
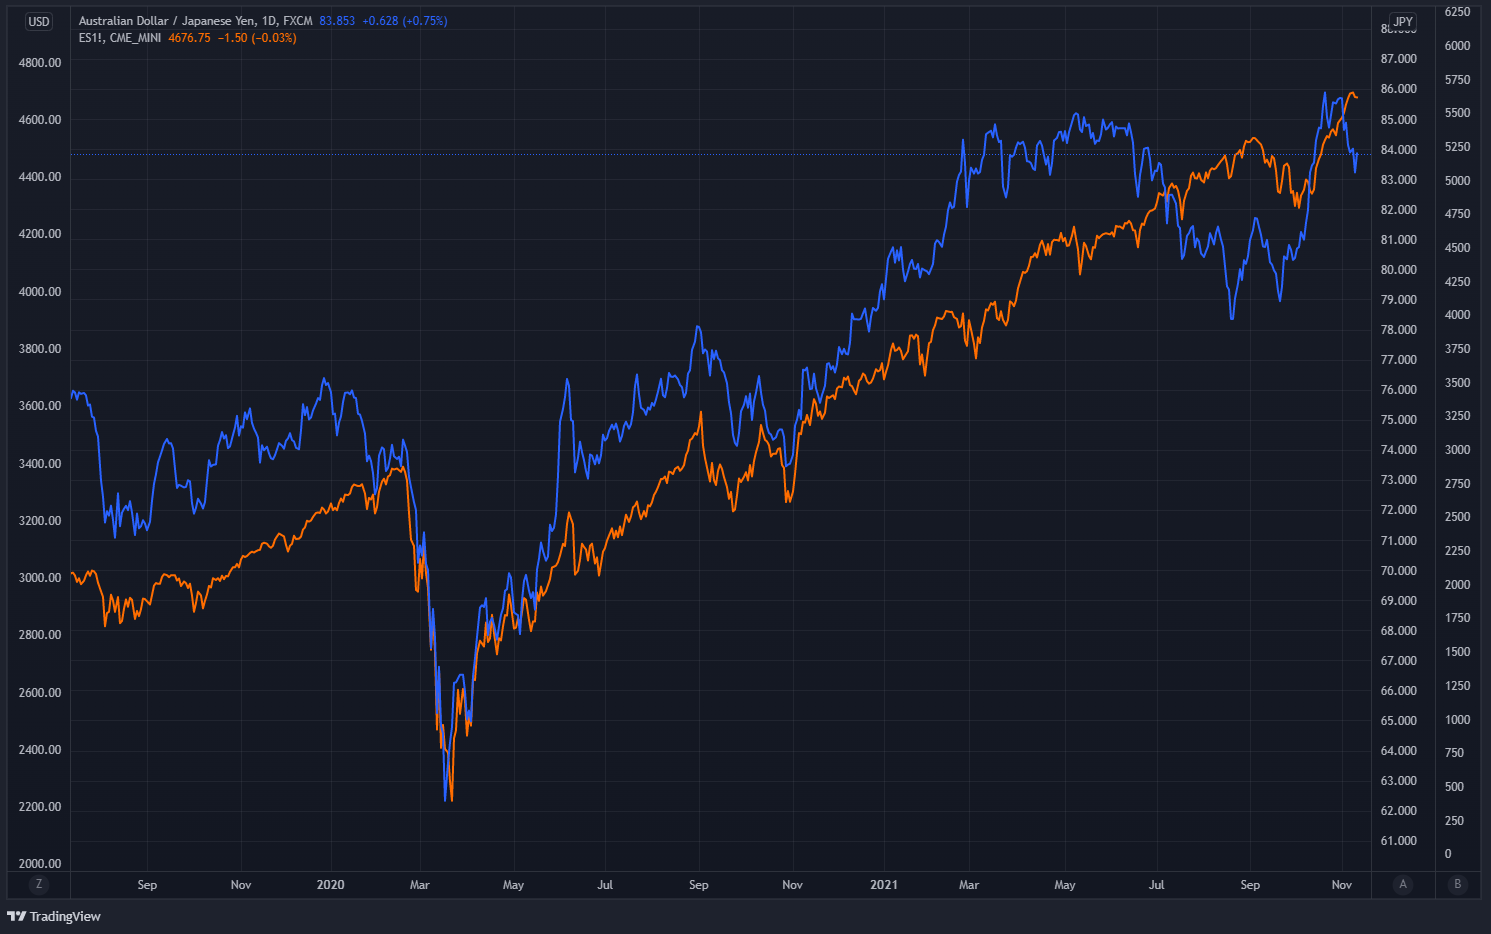
There has also been a significant shift in risk-taking globally with risk-on currency pairs, such as the Australian Dollar and Japanese Yen. The currency cross is a risk-on signal tied to strengthening global growth prospects. Australia is a commodity-driven economy highly leveraged to China’s growth. Meanwhile, the Japanese Yen is seens as a risk-off, safety trade. This currency cross is highly correlated to the S&P 500 over the years. More recently, it has witnessed a considerable divergence from the S&P 500, which would suggest the S&P 500 may be getting ahead of itself and due for a significant reversal lower.
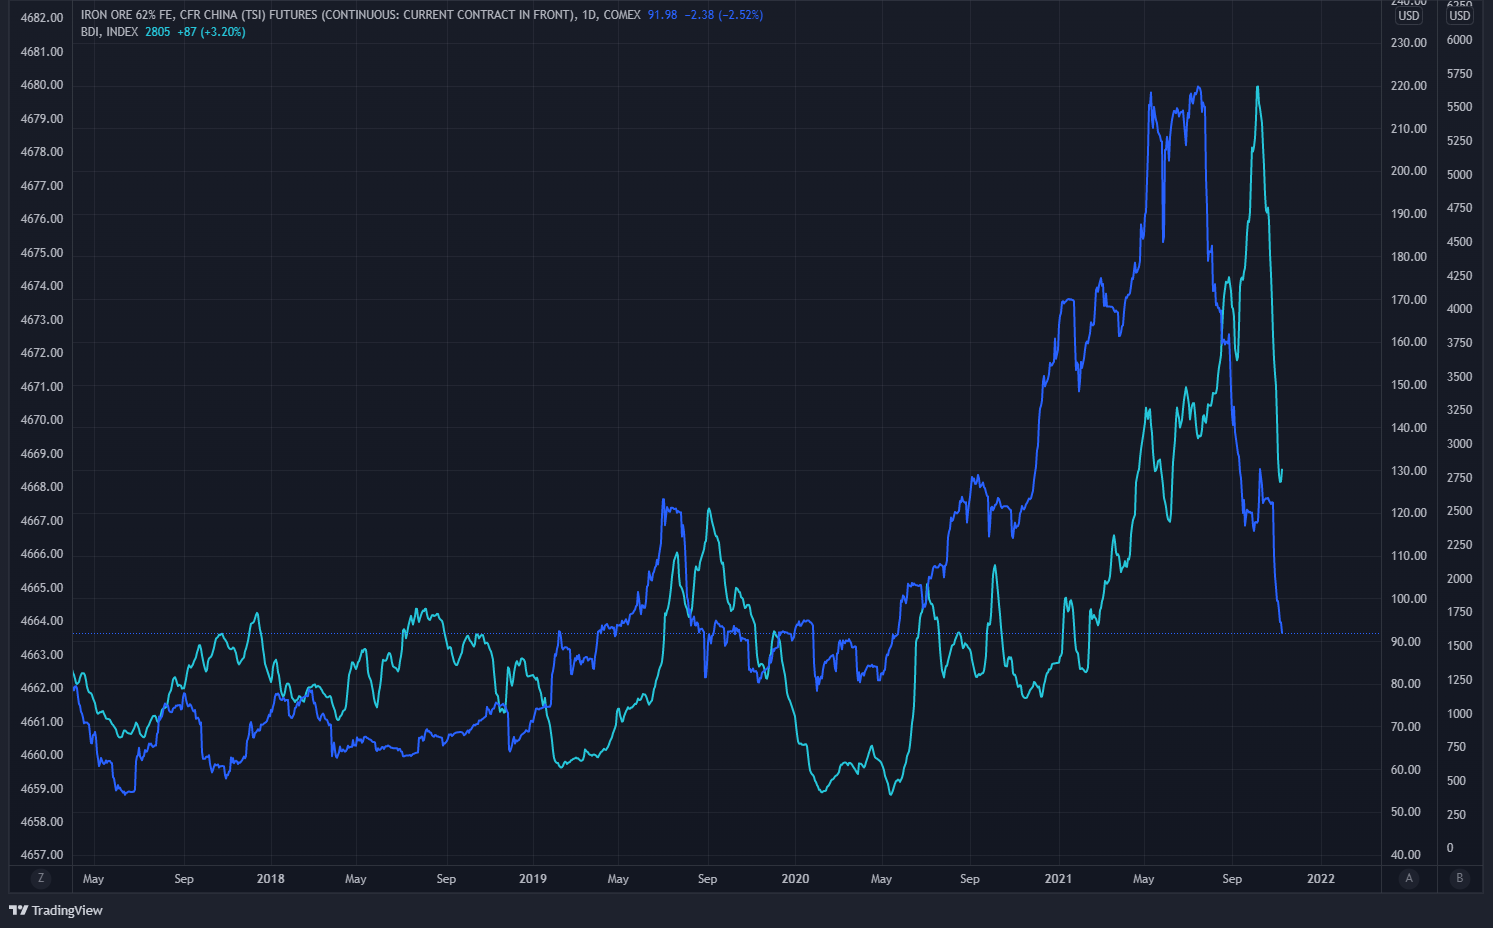
One reason why the currency cross may be is weakening is because of slowing growth and rising prices in China. The Chinese manufacturing sector has contracted two months in a row, and producer prices are at extremely high levels. Additionally, the price of iron ore, a key component in steel, has plunged by more than 50%, resulting in the Baltic Dry Index dropping by a like amount in about a month. It is likely due to weakening demand for steel and could directly be tied to the weakening property sector in China.
The flatter US curve and China economic slowdown seem to be causing some concern in global markets, signals of slower global growth going into next year, and perhaps even worse, a collection of central bank policy errors. Maybe the market is projecting a stagflationary sort of outlook at this point, or just a drop-off in global demand. Either way, this is something that the equity market can’t and will not ignore forever.
Equity Hub Models
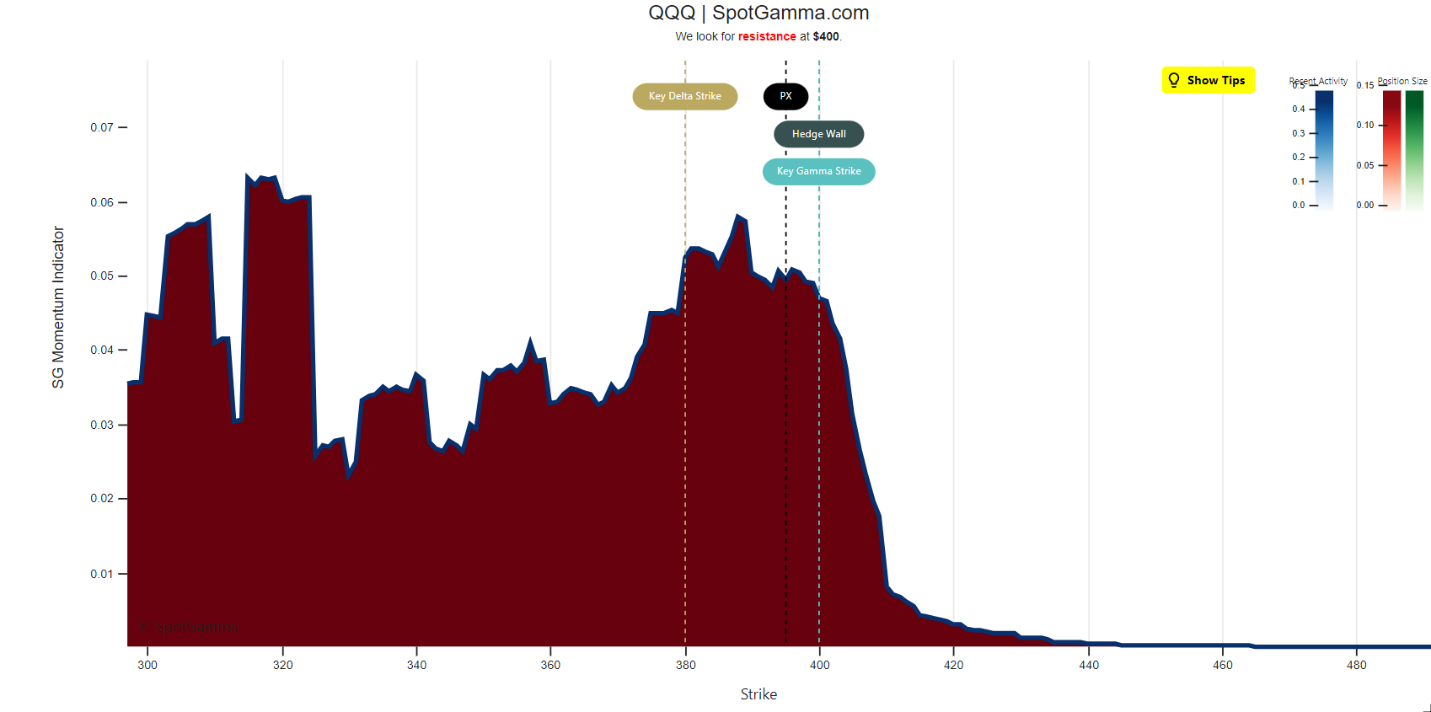
The SpotGamma Equity Hub model for the S&P 500 shows the potential for a drop-off in the index to around 4,550 or around 3%. But that’s not where the risk lies; that risk is in the NASDAQ 100 ETF (QQQ), with the model showing a potentially massive drop in the ETF should it fall below $388, with only some minor support from a gamma perspective at $360 and then $342, and no significant support until $325.
While it may seem like seasonality is in play here, and all the market can do is melt higher, I would caution against that. Because what is happening in the background suggests quite the opposite and it may only take the slightest nudge for the markets to go from a melt-up to melt-down.