The following is a guest post courtesy of Michael Kramer of Mott Capital Management. On November 12, I warned that dreams of a seasonal run higher were in doubt and that an end-of-year melt-up could quickly turn into a meltdown. It seems that instead of stocks cruising into the end of the year, they have […]
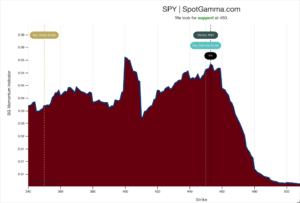
SPY gamma
SPY Gamma Visualization
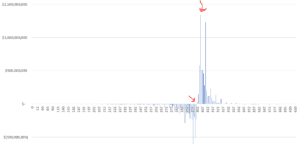
Below is a chart of gamma across all strikes in SPY. You can see that there is a large amount of gamma supply at 305 (right most arrow) and gamma flips from positive to negative around 301. It is below that strike where our model predicts increased volatility as dealers go from buyers to sellers. […]


