• Skip to content
  • Skip to primary sidebar

SpotGamma™

S&P 500 Stock Market Gamma Trading Levels Based on Options Open Interest

  • Subscribe Now
  • Products
  • Blog
  • FAQ
  • Contact
    • About
  • Members
    • Account
    • Portal
    • Equity Hub 2.0

Oct 31 2019

SPY Gamma Visualization

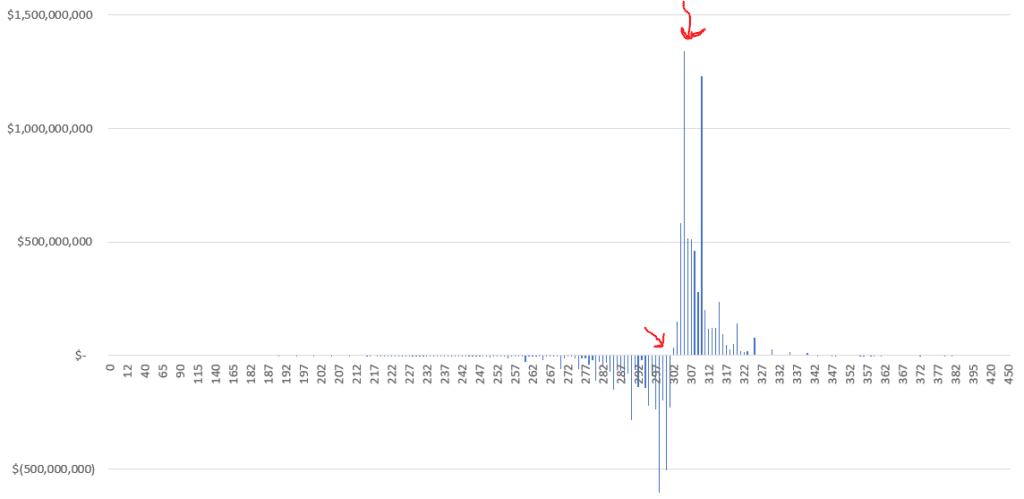
Below is a chart of gamma across all strikes in SPY. You can see that there is a large amount of gamma supply at 305 (right most arrow) and gamma flips from positive to negative around 301. It is below that strike where our model predicts increased volatility as dealers go from buyers to sellers.

SPY Gamma Chart Visualization

There are a many ways you may chose to use this information, here are a few examples to research:

  • Hedge or sell positions when market crosses the 0 gamma threshold
  • Sell calls or close long positions when market approaches the “call wall” (295 in chart above)
  • Short volatility when market is positive gamma territory, long volatility when it is below.

We provide a daily gamma snapshot and levels to subscribers.

  • Click to share on Twitter (Opens in new window)
  • Click to share on Facebook (Opens in new window)
  • Click to share on LinkedIn (Opens in new window)
  • Click to share on Reddit (Opens in new window)

Written by Spot Gamma · Categorized: Market Analysis · Tagged: long gamma, SPY gamma, zero gamma

Primary Sidebar

Popular Posts

spotgamma-sidebar-weaponized-gamma-sidebar
spotgamma-sidebar-yolo-trade
did-softbank-weaponize-options-gamma-whale
goldman-gamma-op-ex-option-driven-equity-flow
spotgamma-on-the-market-huddle

Categories

  • Dark Pool (1)
  • Market Analysis (262)
  • SpotGamma Updates (4)
  • Stock (47)
  • Trade (3)
Follow @spotgamma on Twitter!
  • Subscribe
  • Disclaimer
  • Account
  • Portal

©2021 TenTen Capital LLC DBA SpotGamma