For this example, 2900 in the S&P500 is identified as a strike with large put interest in SPX options.
The theory behind Put Walls:
We make an assumption that most of those puts were bought by hedgers, therefore market makers and dealers are short those 2900 puts.
As a result they must short sell stock against those puts.
That creates a negative gamma position wherein dealers are shorting as the market drops and buying back as the market rises. But it also (in theory) makes them buy back if volatility drops.
As volatility drops the put options become less valuable, therefore the dealers need less of a hedge.
Because their hedge on a put is short stock, they will have to buy back stock to reduce their hedge.
You can see in the chart below that even though we initially pushed through 2900, lack of further large sell volume led to a natural rise in the S&P as volatility came in.
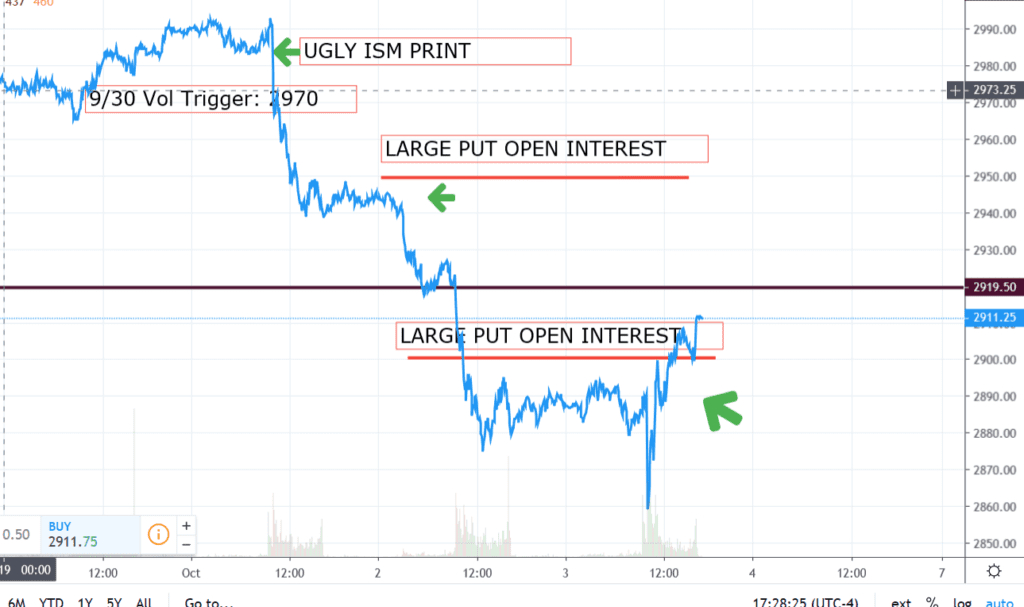
As the market rises and volatility comes it you also have the put-owners selling their puts, which means dealers have to buy back more stock. This can create a reflexive scenario where put selling pushes the market up, volatility down, and influences more put selling. We tend to look for the rally to continue up to where gamma goes back to zero (see Volatility Trigger here). At this point we believe that dealers have no market impact and therefore the “fuel” for the rally may be gone.
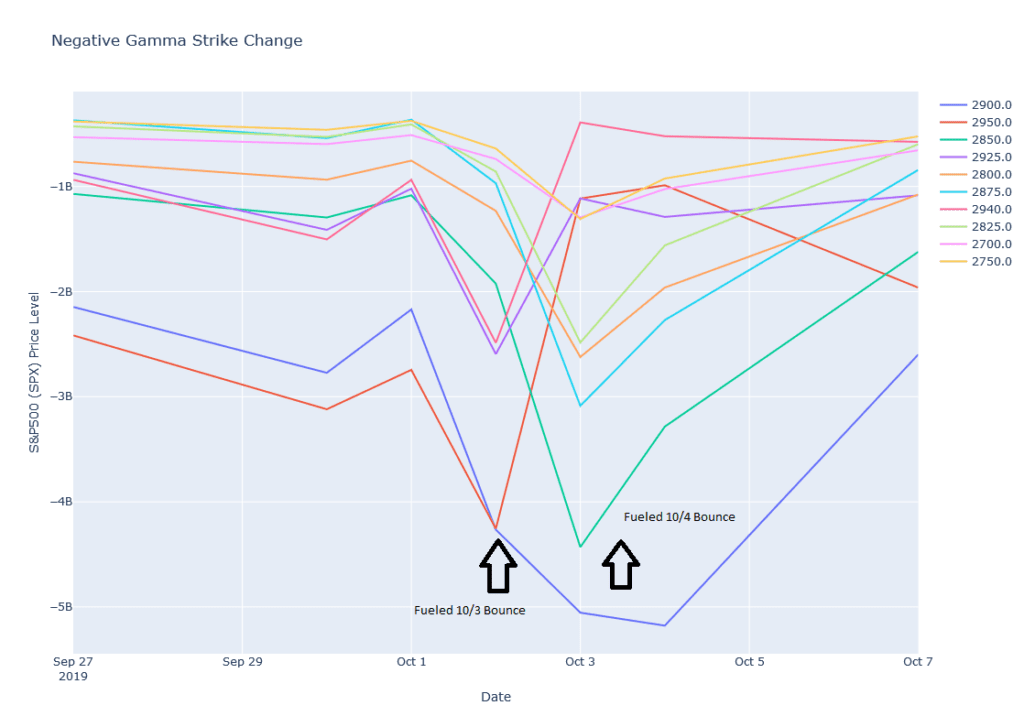
EDIT 10/7/19: Further data from the most recent selloff supports large gamma put strikes closing up before the rally in the S&P500. You can see the 2950 strike reduce negative gamma greatly on 10/2 as an example. There was a solid rally despite negative economic news on 10/3.