The following is a guest post courtesy of Michael Kramer of Mott Capital Management.
Bond yields have soared in 2022, sending ETFs like the iShares 20+ Year Treasury Bond ETF (TLT) lower by around 10%, but almost 25% off its 2020 highs. The ETF now comes to a critical juncture, signaling rates pushing significantly higher or lower.
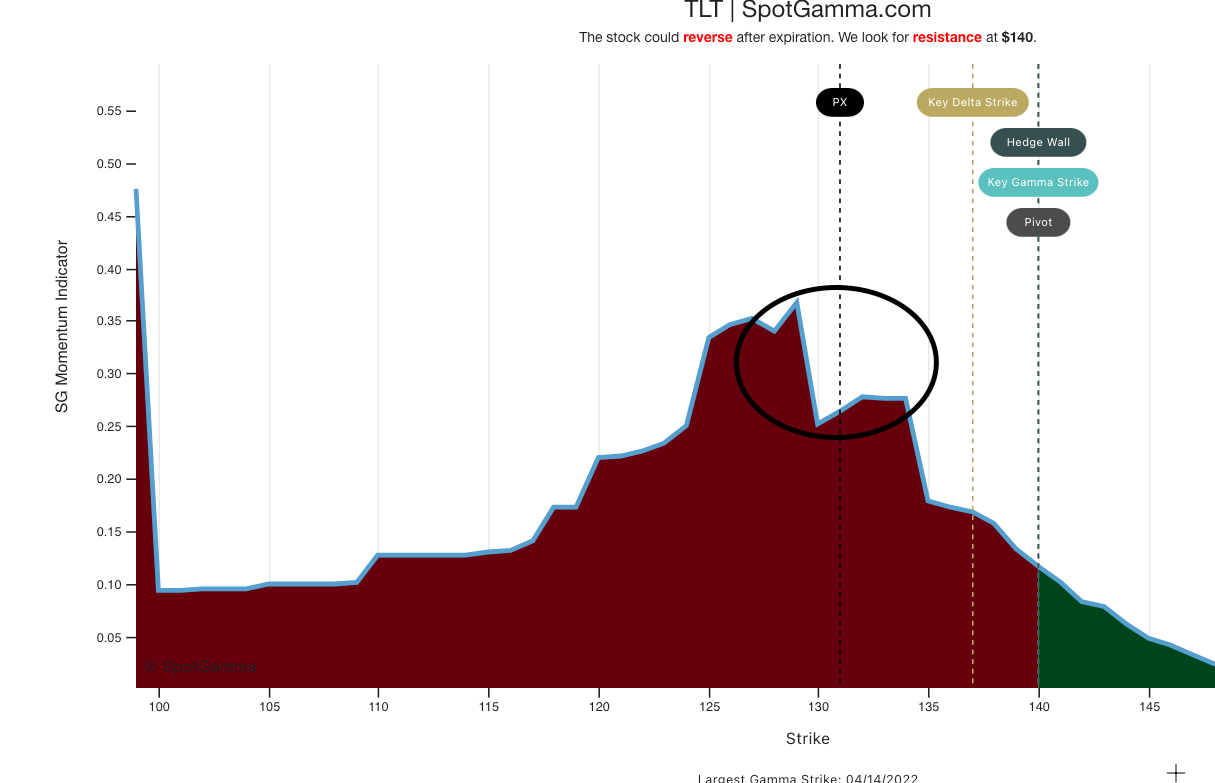
If it sounds like doublespeak, there’s a reason for that: rates continue to waver between a rise and a fall. However, the SpotGamma Equity Hub model shows that $129 to $130 on the TLT may hold the key to what happens next. It probably doesn’t come by chance that the technical charts show that the region around $130 has become a critical level of support, suggesting the TLT begins to rise and therefore pushes yields lower due to their inverse relationship.
Gamma to Offer Support
The Spot Gamma Equity Hub model shows a notch in Gamma levels around $130 for the TLT and then a big jump in the Gamma levels between $125-$129. A considerable Gamma level is likely to help support the TLT and, in turn, help keep yields on the long end of the curve from moving even higher. The chart shows that Gamma in the TLT is supportive until $125. If the TLT should drop below $125, the sell-off in the ETF and long-term bonds could significantly intensify, pushing the TLT below $120 as Gamma levels begin to decline, signaling higher interest rates.
Technical Reversal
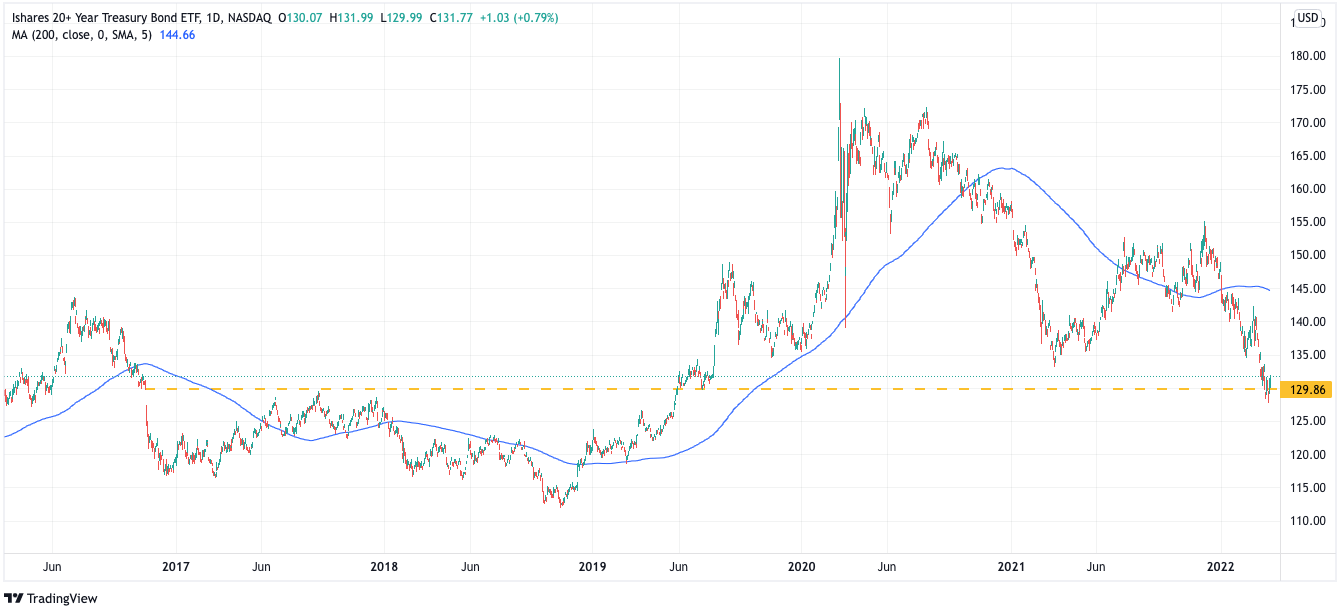
From a technical standpoint, $130 has been an enormous support/resistance region level in the TLT since early 2016, as shown in the chart below. That price point often demarks big moves higher in the TLT or significant drops. So, it doesn’t seem surprising that the TLT has paused and is now consolidating around $130.
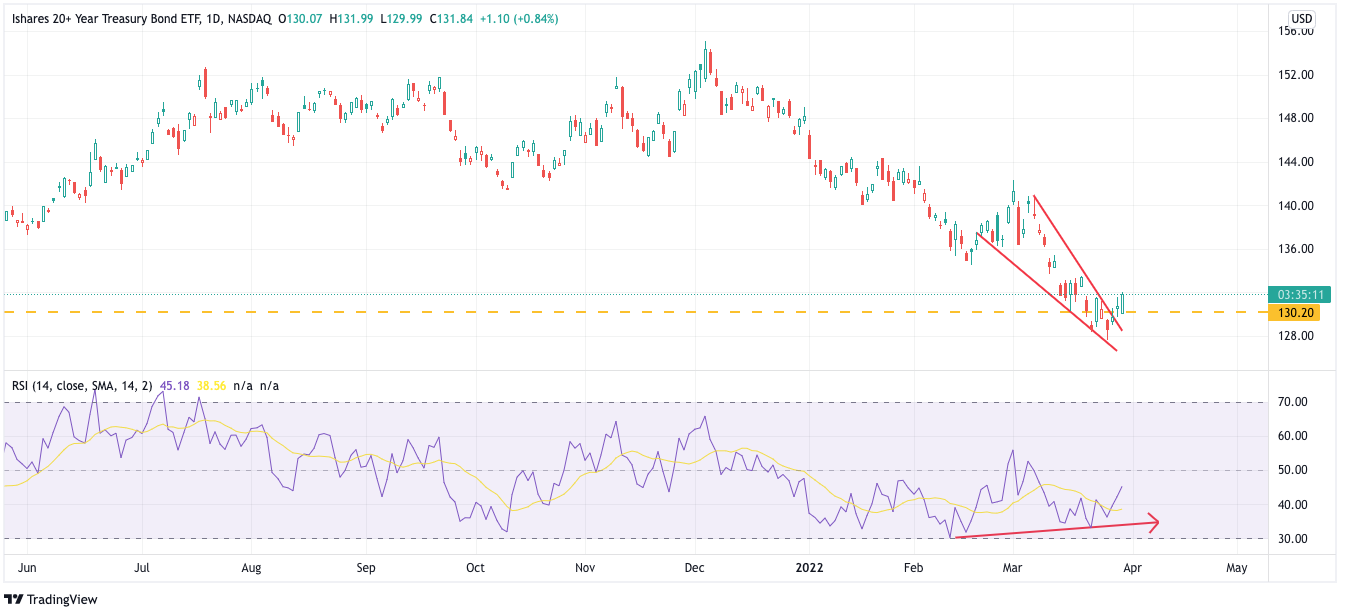
The technical picture suggests the TLT may be heading higher from here. The chart shows a bullish divergence formed on the Relative Strength Index, which has been making higher lows. Meanwhile, the price of the ETF has been making lower lows, an indication that momentum in the TLT may be shifting from bearish to bullish and soon to rise. The TLT has also formed a falling wedge (a bullish reversal pattern), indicating that the ETF reverses higher, potentially back to $140.
Yield Curve Worries
From a fundamental standpoint, it may seem to make very little sense to see long-term interest rates falling as the Fed raises short-term interest rates. But at the same time, it seems to make perfect sense with what the bond market has been projecting recently, with the flattening and now inversion of the yield curve.
Bonds seem to be getting very worried that either the Fed will have a tough time getting inflation under control without causing a recession, or high inflation rates will cause the recession. If these worries persist, it should lower yields on the long end of the curve, resulting in an intense inversion as short-term rates move higher.
Now seems like a perfect time for buyers of the TLT to make a stand and take back control. If not, the wave of selling in bonds will only worsen, resulting in surging bond yields and a plunging TLT.