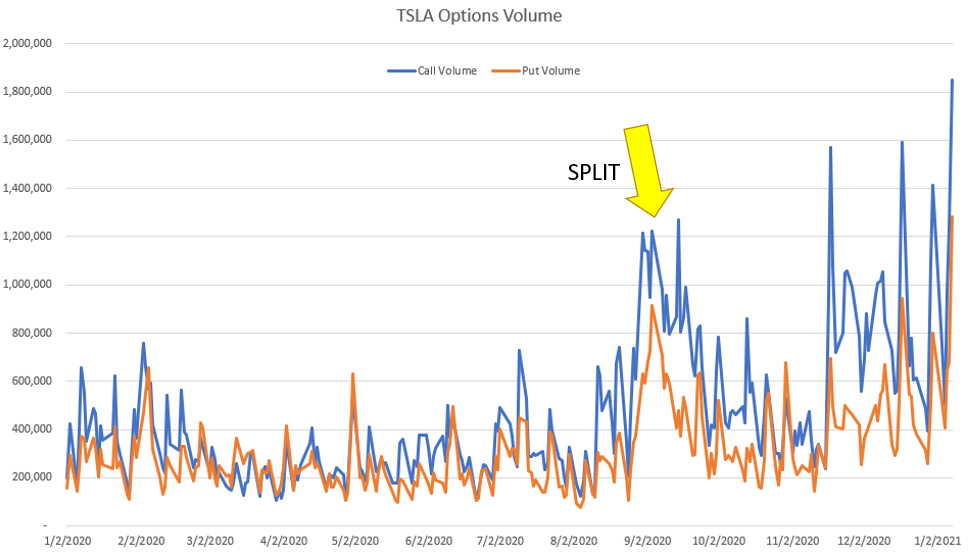
The week ending 1/8/21 saw a record high in TSLA options volume, with the stock surging nearly 20%. Traders have been flooding into weekly options as the way to express their views on the stock which was just recently added to the S&P500 Index. We view increased buying of call options as a driver for the stock prices, as dealers (who are short calls) must buy the stock to hedge. This implies then that record call volume in TSLA should be linked to the record stock price.
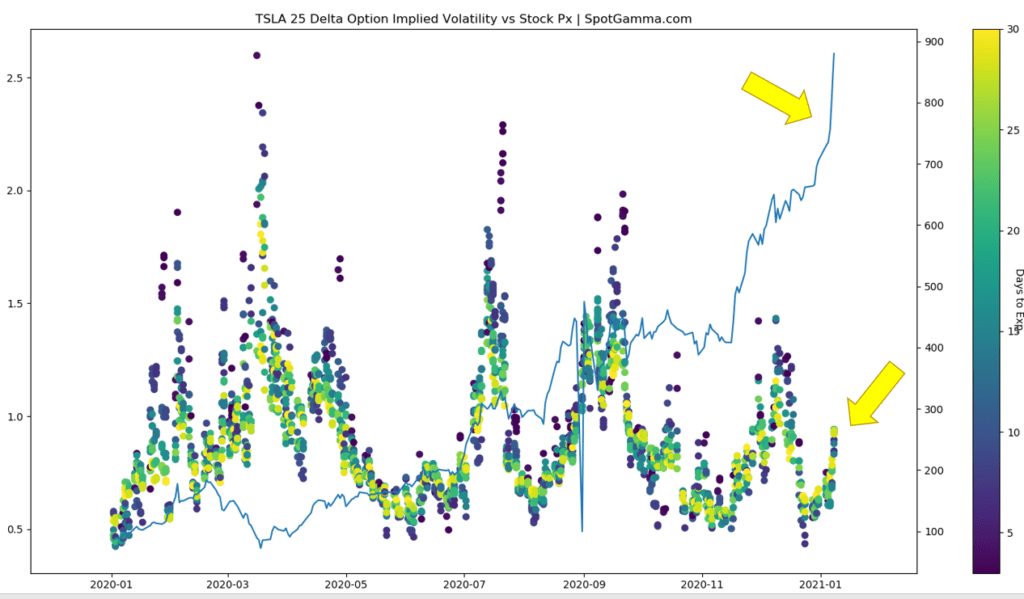
Below we plot 25 delta option implied volatility (IV) on the left, vs the stock price on the right. The colors code the days to expiration for each 25 delta option so that we can get a fair comparison of IV levels across time. TSLA IV is well off ’20 highs despite this surge in options volume and 20% jump in stock price. This implies that even though there is record option volume, the prices of those options aren’t high relative to recent history.
Thats interesting data in light of TSLA price action this past week. Each day this week most of the gains were made during price gaps at the open, as indicated by the green arrows below. The first three days of the week recorded call volumes ~500-900k, and price action was fairly flat for most of the day.
Then on Thursday and Friday we saw a surge in call volumes: 1.2mm and 1.8mm respectively. Both Thursday and Friday the stock increased 8%.
Note the price action on Friday in the chart below, wherein the stock declined 4% off highs (red arrow). Had the majority of incoming positions been long calls, we would expect the stock to see a continued surge as dealers (who are theoretically short calls) buy stock as a hedge.
Again assuming dealers are short calls, even if call buying simply subsided the decay of those calls into 1/8 expiration would lead to an unwind of long stock hedges. $800 was our high gamma strike, a level we often see as a “pinning” area due to the effects of time decay and hedge adjustments (charm). Therefore you’d think that the “red arrow” dip on Friday would have higher pressure toward that large $800 strike which held such large options positions.
Instead what happened was stock price mean reversion, which suggests dealers had a positive gamma position due to being long calls. This implies the bulk of trader/investor calls were sold. There is evidence for this, below.
Here we have data provided by the OCC. It portrays a rather unsurprising trend higher in options buying, but what caught our eye was the surge in options selling to open. This indicates large short call positions were initiated last week.
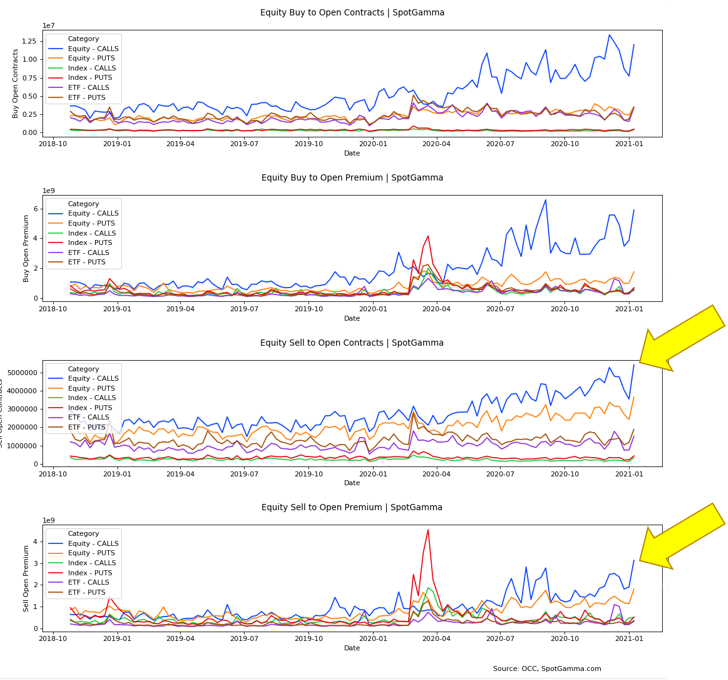
Based on Fridays figures, TSLA account for roughly 4.5% of total options volume. Combining the low relative implied volatility, Fridays price action, and OCC data therefore suggests that large options sellers have been entering positions with TSLA stock at extreme valuations (1300 P/E ratio).
There is a significant >40% of total TSLA gamma, and >25% of total delta expiring Friday 1/15. It appears there are a lot of $600 strike calls set to expire, and as these large positions expire it can bring pressure in the stock as dealers unwind in-the-money long stock hedges.
Today TSLA has struck a negative tone, with the stock down 6%. This is an extremely dynamic situation, but our models initiated today with $900 strike as resistance. As indicated by the SG Momentum index below, volatility may pick up into the $800 strike.
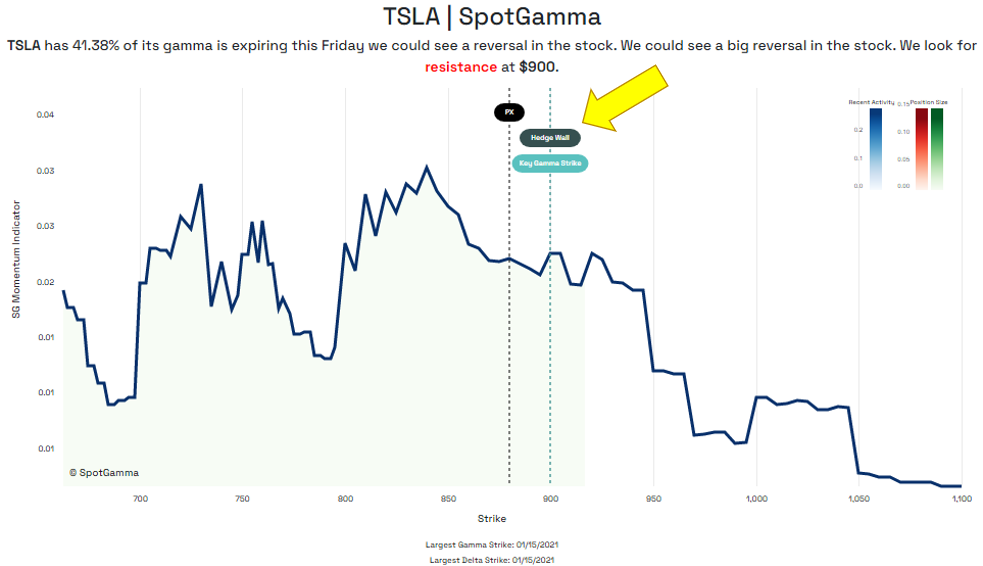
Based on this data anticipate some churn in the $800 price area for the remained of this week, and a sharper directional move the week after.
If we are correct in that sentiment has shifted from predominantly long call to short it may mark a key sentiment change in the stock. With the addition of the large expiration we could see an extended period of consolidation in the stock.