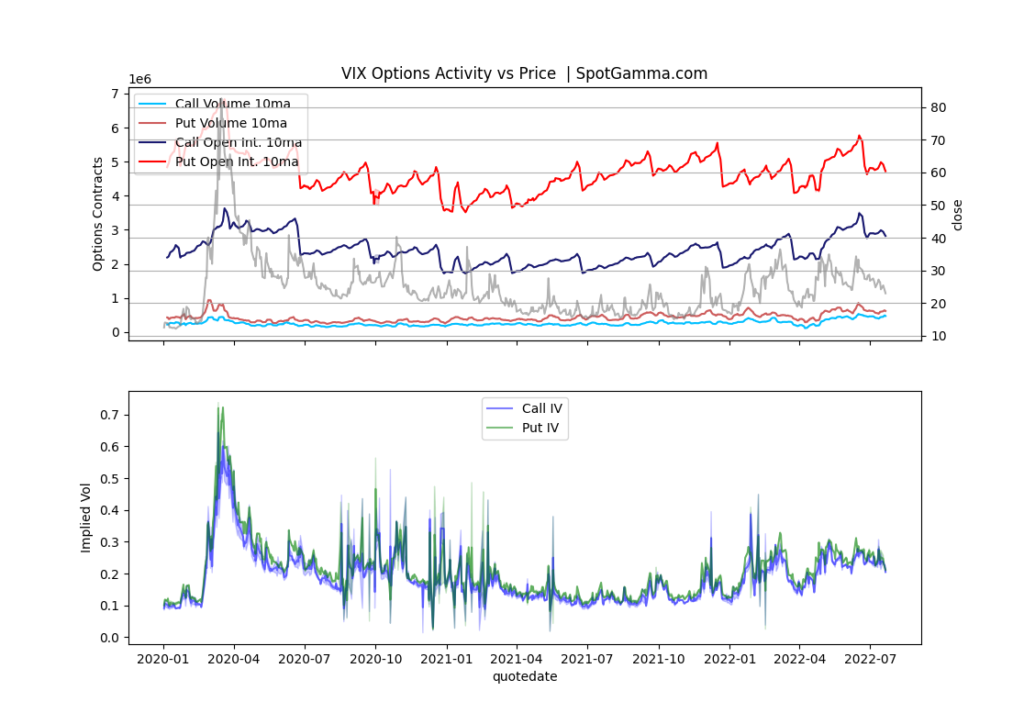
As of July 22nd the S&P500 is down 15% YTD, after being down ~25% on the June lows. Despite this poor performance, the VIX has remained subdued having peaked on January 24th after a vicious OPEX-induced selloff. This means that the VIX did not break to new highs despite the Russian invasion of Ukraine, blistering hot CPI readings, or disastrous mega-cap earnings.
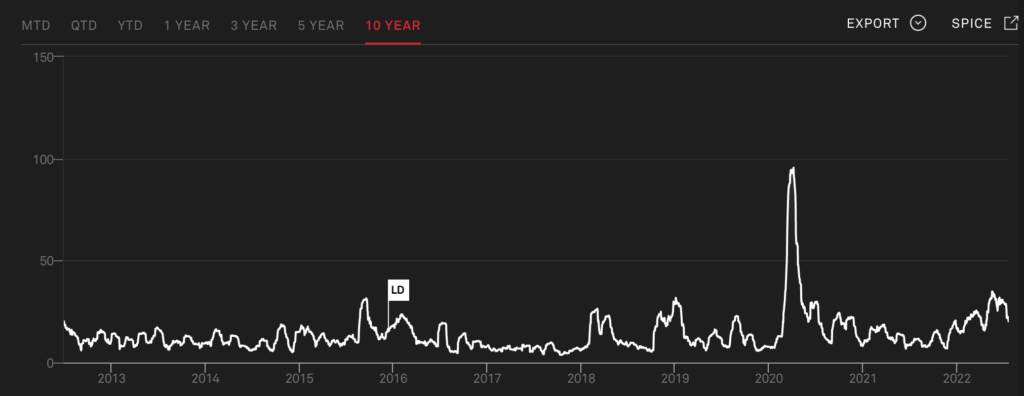
This rather placid VIX performance is in the face of high realized volatility as shown below. In fact, realized volatility has been higher this year than at any other point in the last 10 years, outside of a brief window in late March of ’20 (a time wherein the S&P lost >30% in two weeks).
There are a myriad of reasons traders have attributed to this surprisingly low option implied volatility – primary of which is “the market has been well hedged”. Regardless of the “why” it does seem that owning convexity by and large has not paid throughout this market decline.
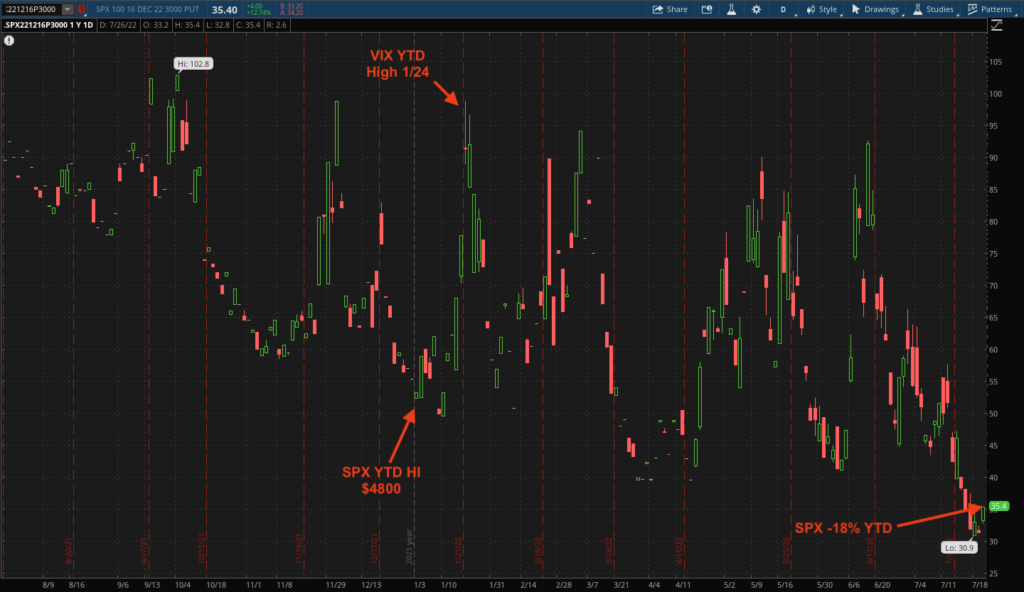
This is evidenced in the recent price action of S&P500 puts, shown below. Here you can distinctly see the drop in value for DEC $3,000 puts in July as implied volatility (e.g. VIX) collapsed.
Another view of this is offered through the Nations Tail Dex [TDEX], which tracks the prices of OTM S&P500 options. TDEX has made new lows into July, despite the S&P500 being -18% YTD. The lack of convexity (or higher implied volatility), we believe, has led traders to start selling deep out of the money put positions which has recently buoyed the market.
This has arguably become something of a feedback loop, wherein the failure of extreme convexity in the past may have drawn out put sellers who feel that convexity will not appear in the future.

The issue here (as we discussed in a recent video), is that it appears many of the risks spurring the market drawdown still remain:
- Fed tightening
- Recession risk
- Geopolitical tension
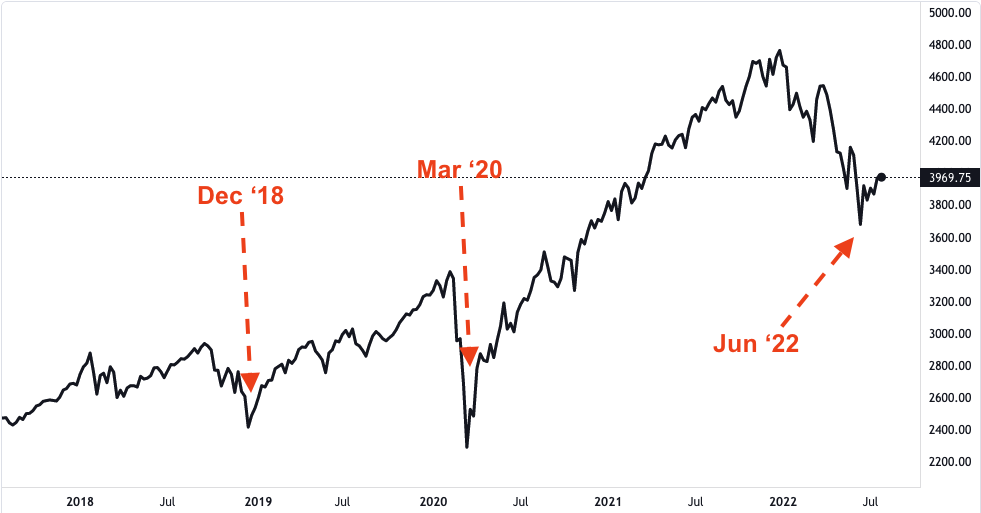
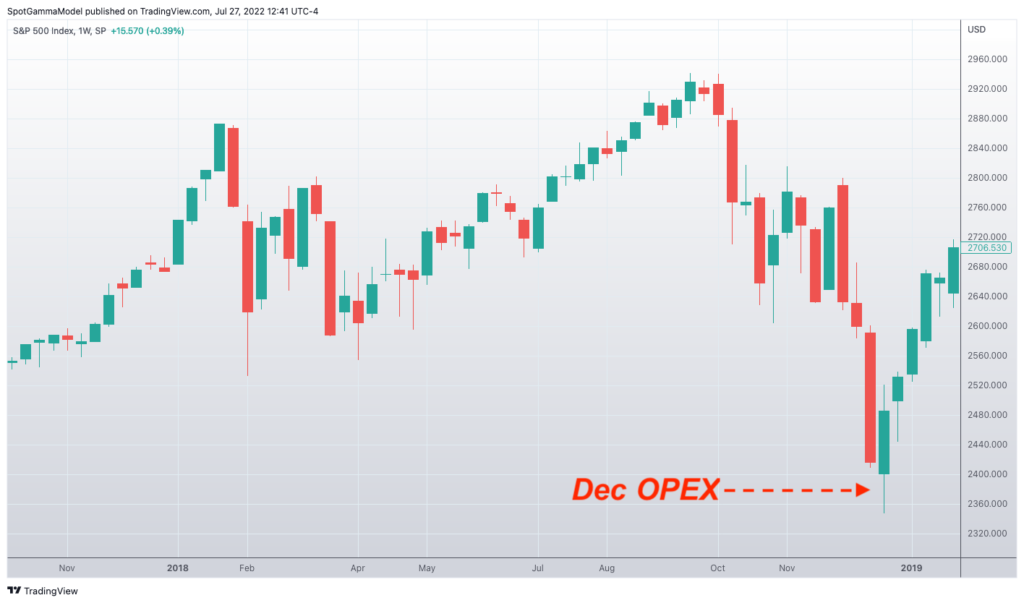
We’d also note that major lows in recent history have arrived with the combination of major options expirations and explicit fiscal/monetary support. Most notably this was in December of 2018 & March 2020.
While June ’22 was a large options expiration in which large put positions expired, the Fed is currently in a tightening cycle. We believe that the market will only put in a significant longer term bottom when markets decline into a large options expiration which times with the Fed shifting to a more accommodating stance.
We therefore are of the opinion that traders should start adding convexity to their portfolio which protects them into year-end. Should markets start to unexpectedly slide lower, volatility may increase at a more rapid base due to the fact that traders have been selling out of the money puts.
To this point we think the market performance from 2018 is an interesting analogy for today. 2018 stated very weak before rallying into the summer months. Into Q4 relentless selling increased, before the market bottomed on Christmas Eve. 2018 was also characterized by concerns that increasing interest rates would lead to a recession.
A VIX Footnote
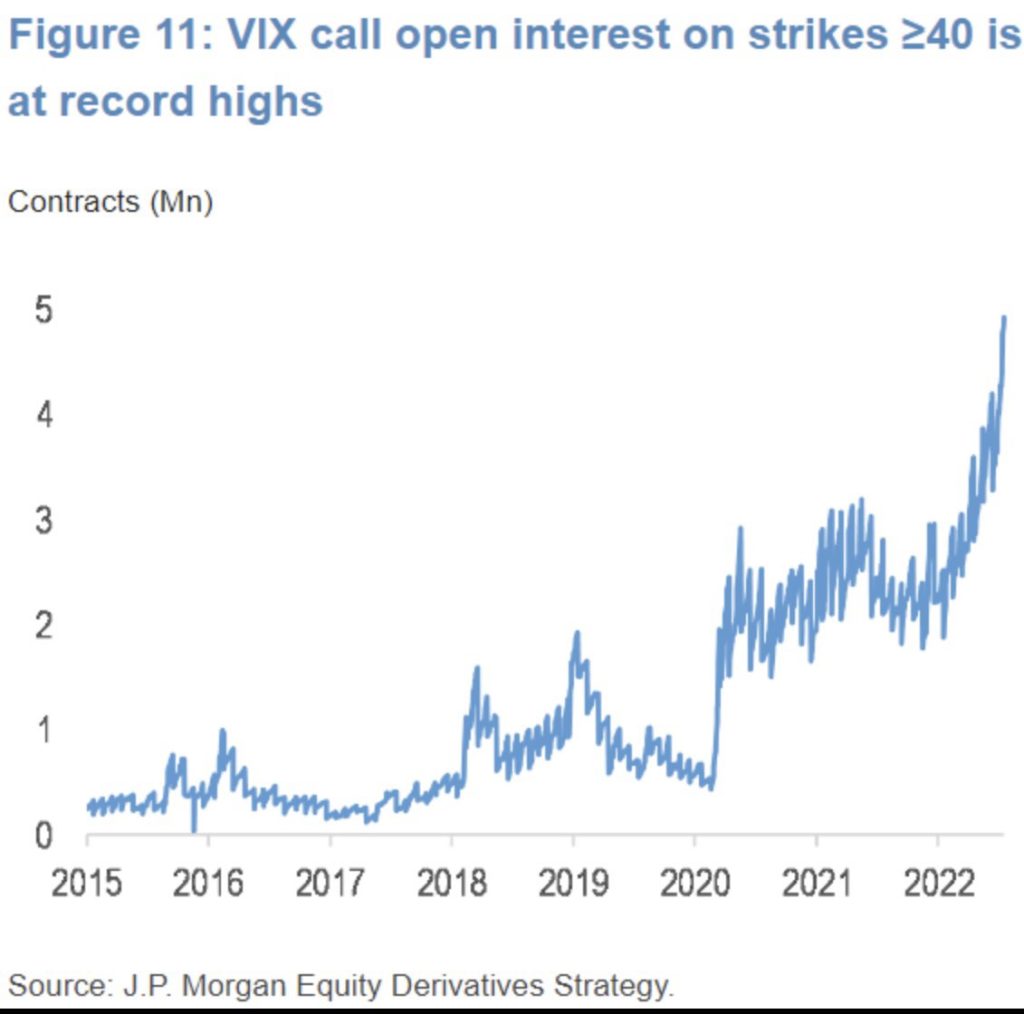
Where traders do appear to be buying some tail hedges in in the VIX complex. The chart below from JPMorgan shows that there is a large spike in VIX call positions above the 40 strike.
These positions are concentrated in the 70-85 call strikes, in October and November expirations.
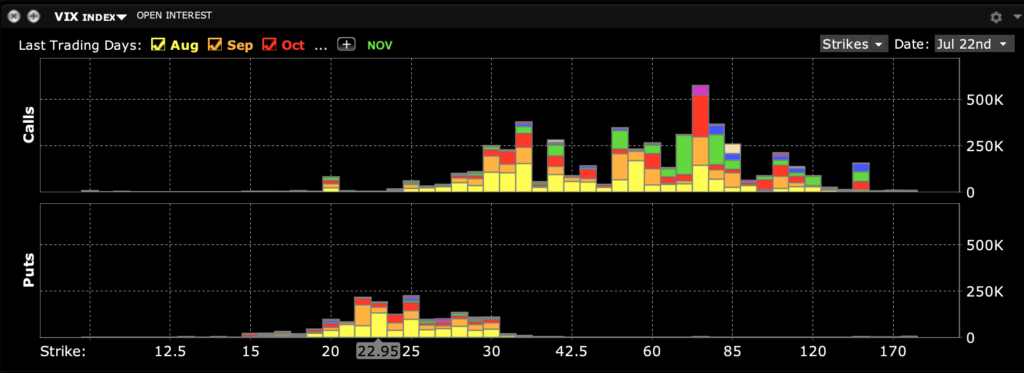
These large call positions are not seen across other VIX strikes, as overall VIX call interest (dark blue) remains elevated, but not at record levels.