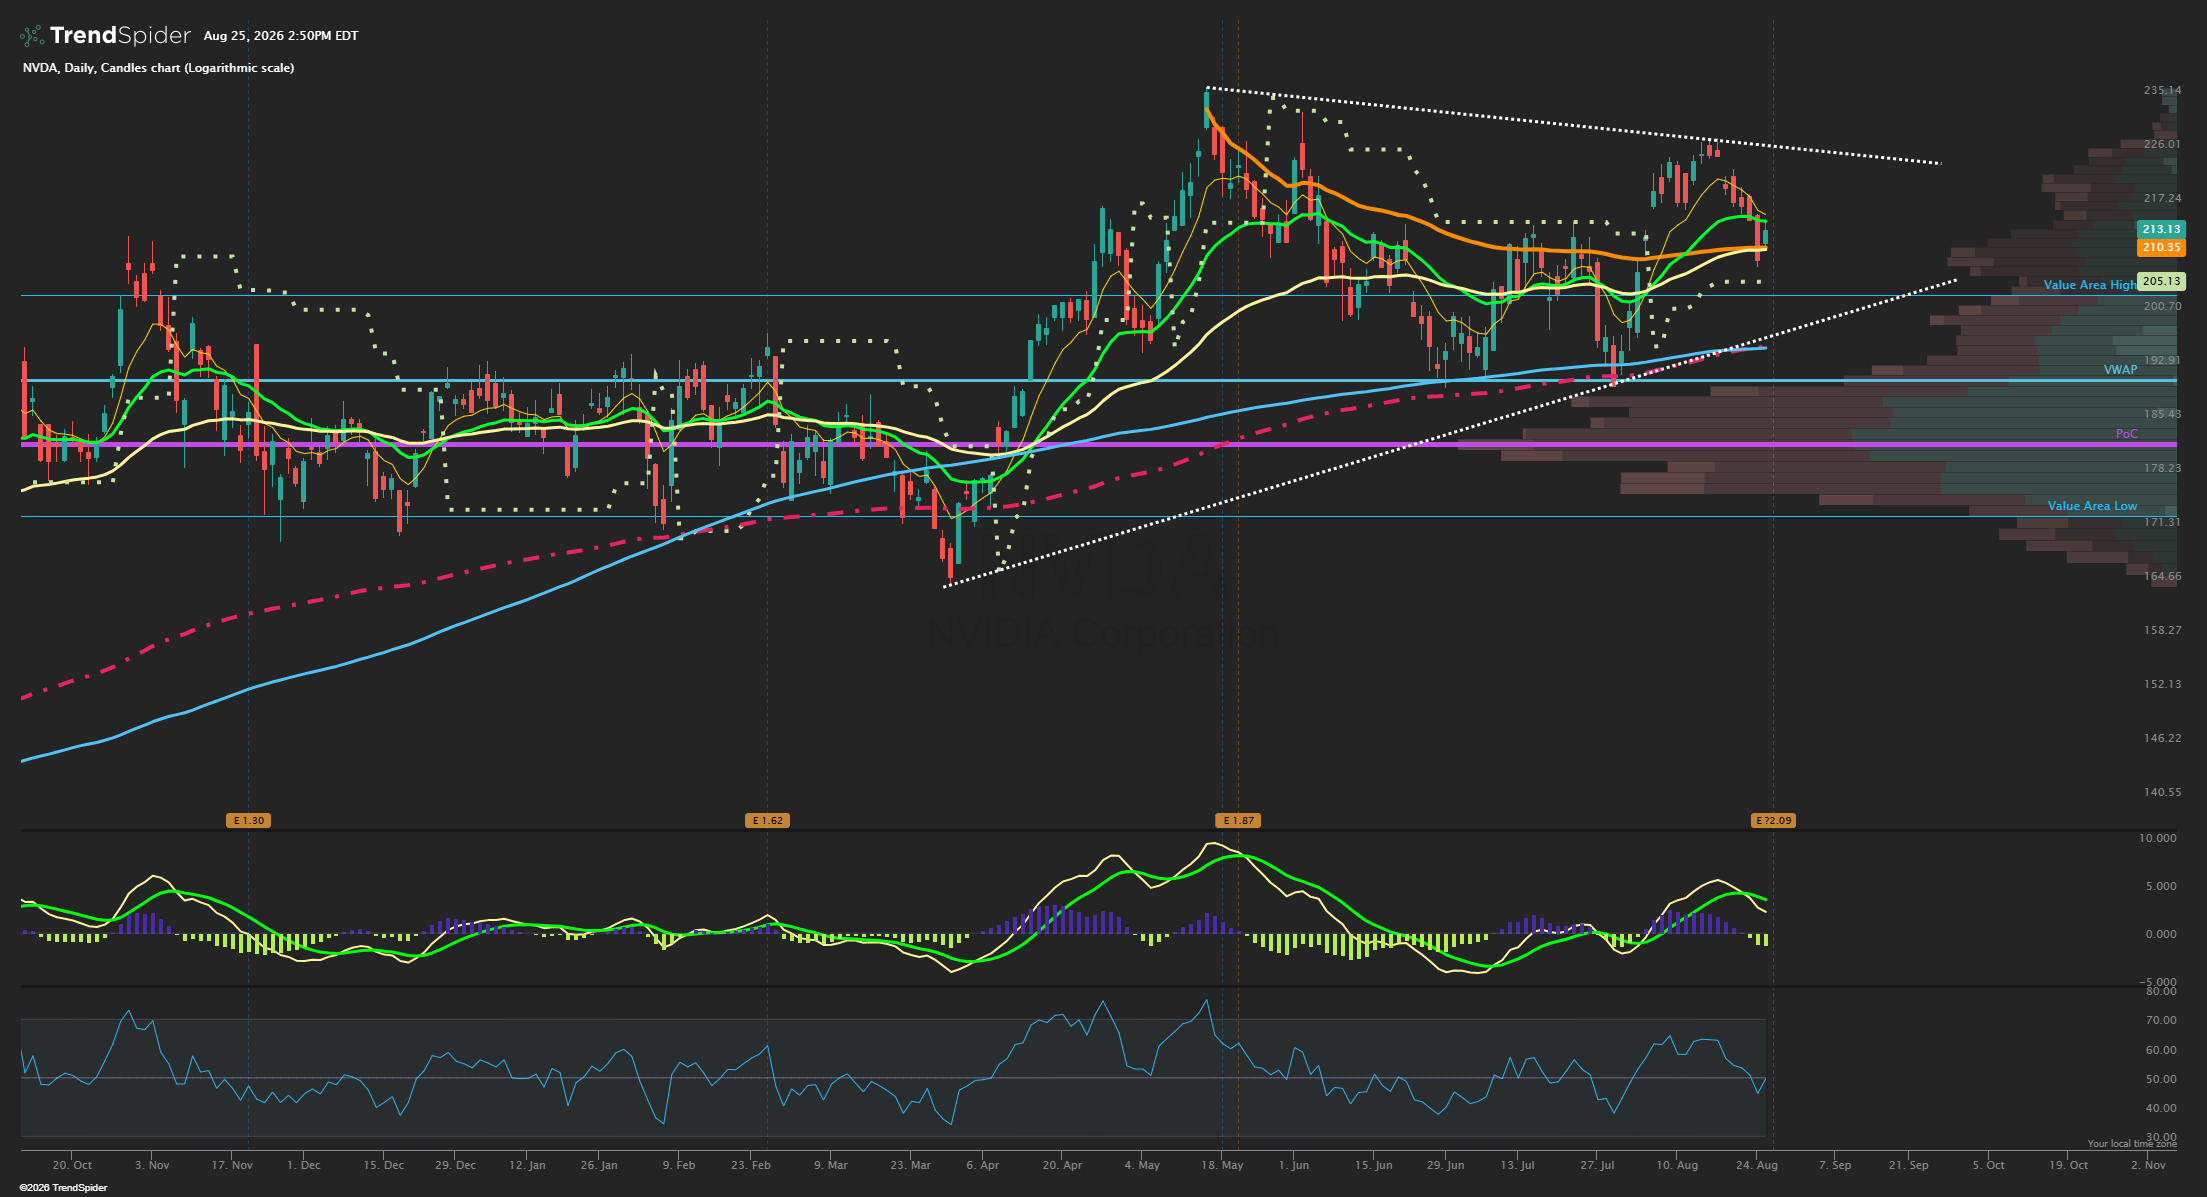
Nvidia (NVDA) reports earnings on Wednesday 8/26 after the market closes, with results expected around 4:20 p.m. ET and the conference call at 5:00 p.m. ET. The Street is expecting EPS of $2.09 with revenues of $92.28 billion, nearly doubling year over year as a leader in the AI chip space. (Source: Briefing)
More importantly for options traders, the options market is pricing roughly a 5.5% earnings move. The setup is particularly interesting because NVDA’s current implied earnings move is smaller than its historical realized earnings movement. The last 12 quarters the stock has seen an average realized move of +/- 7.4% which would imply the current implied move is underpricing its potential move. That’s unusual enough that we would be less enthusiastic about blindly shorting earnings volatility than we normally would be in NVDA.
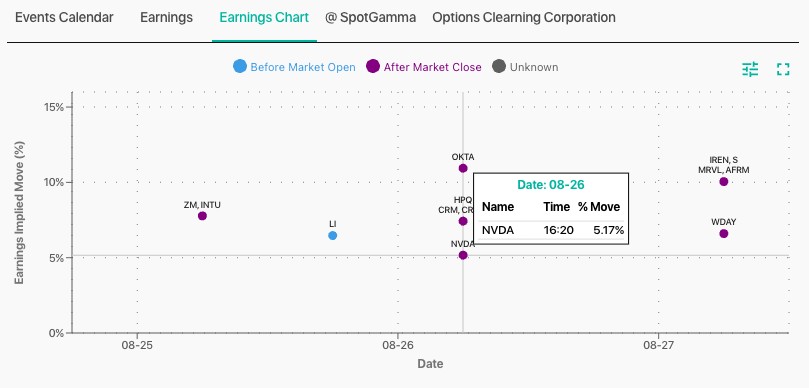
At a roughly $211 stock price, a +/- 5.5% move gives:
- Upper implied boundary: ~$222–223
- Lower implied boundary: ~$199–200
Those levels happen to align well with options positioning.
For Aug. 28th expiration, call OI is particularly large around $220, $222.50, $230 and $240, with roughly 78,000 contracts at $230 and 60,000 at $240 as of Tuesday’s open interest. The $230/$240 call spread looks to have traded over 120,000x on Tuesday with a large buyer paying a cheap outlay for a potential bull bet on upside convexity. Open interest will have to be confirmed Wednesday to see if it adds that volume.
Put positioning is concentrated around $210, $205 and particularly $200. Any selloff post earnings could provide support in that 195-200 range which can offer a possible post earnings trade to sell put credit spreads against that zone.
Fundamentals
The bigger issue isn’t whether NVDA technically beats consensus. NVDA has routinely exceeded expectations, so investors are likely to focus heavily on Q3 guidance. Current expectations are around $104 billion of Q3 revenue, while investors will also be watching gross margins, Blackwell demand, Vera Rubin timing, China/H200 sales, hyperscaler spending and NVDA’s increasingly large financing commitments across the AI ecosystem. We would consider roughly $108–110B+ Q3 guidance with stable ~75% margins a much more meaningful bullish signal than merely reporting Q2 revenue of $93–94 billion. (Sources: Reuters, Investors Business Daily)
Technicals
NVDA now has a market cap of $5.1 trillion and is up +13% YTD with much of that coming the past month following the July dip while the past one year return of +17% has actually underperformed the Nasdaq QQQ (+24% in the past year). Technically speaking, the stock has largely waffled around between 175-200 much of the last year with the recent summer rally propelling its price above 210 but the August high formed a lower high of 228 versus the May high of 236.50. The stock has support at the 200 round number with the 200 EMA coming in at 195.50. Any break below on volume would be troubling to the stock and sector.
Analyst Sentiment
Looking at Koyfin estimates, Wall Street analysts are bullish on the stock with an average analyst target of $305. NVDA currently has 59 Buy ratings and just 2 Holds while 1 stubborn Sell rating exists. Overall bullish sentiment from the analyst community but price action is nearly 45% below that average price target.
BMO Capital had a recent Outperform initiation last week and a $340 price target citing that demand remains robust with much of Nvidia’s capacity sold out for the next 12-plus months, and believes Nvidia has a strong financial profile supported by healthy margins and cash flow generation. Morgan Stanley says NVDA is likely to deliver another Blackwell-driven beat and raise, but a meaningful stock catalyst may require clearer evidence on longer-term market share, financing risks, gross-margin durability, and Rubin’s contribution, with 2027 offering additional upside versus consensus. Bank of America sees a compelling valuation at current share levels as it expects NVDA to provide more disclosure around its off balance sheet commitments. (Source: Fly on the Wall)
What Does Dealer Gamma Say?
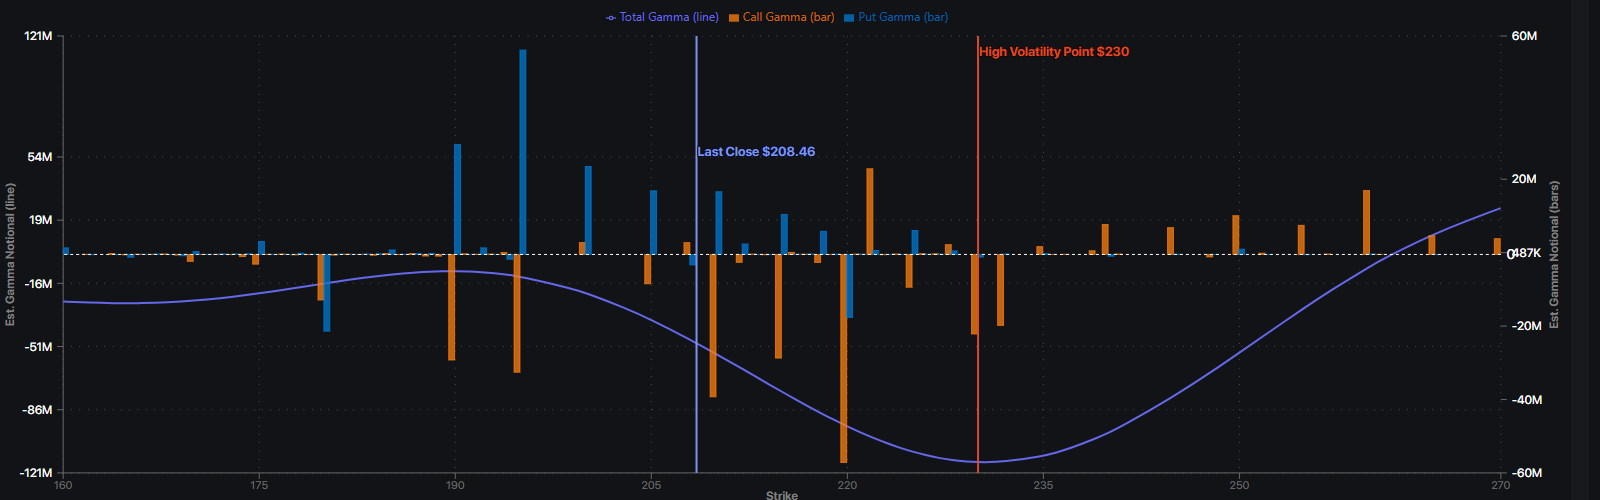
Dealers are meaningfully short gamma to the upside with 220 a major gamma level to monitor above current levels. A strong earnings call and reaction could trigger a rally as dealers are forced to buy stock to hedge their negative gamma stance above that 220 price point which may exaggerate a move into the 230 level as that is where gamma flattens out from a market maker exposure. The current gamma Call Wall sits at 220 and that lines up closely with the implied move the options market is pricing based on Tuesday’s opening, just a 5.5% expected move.
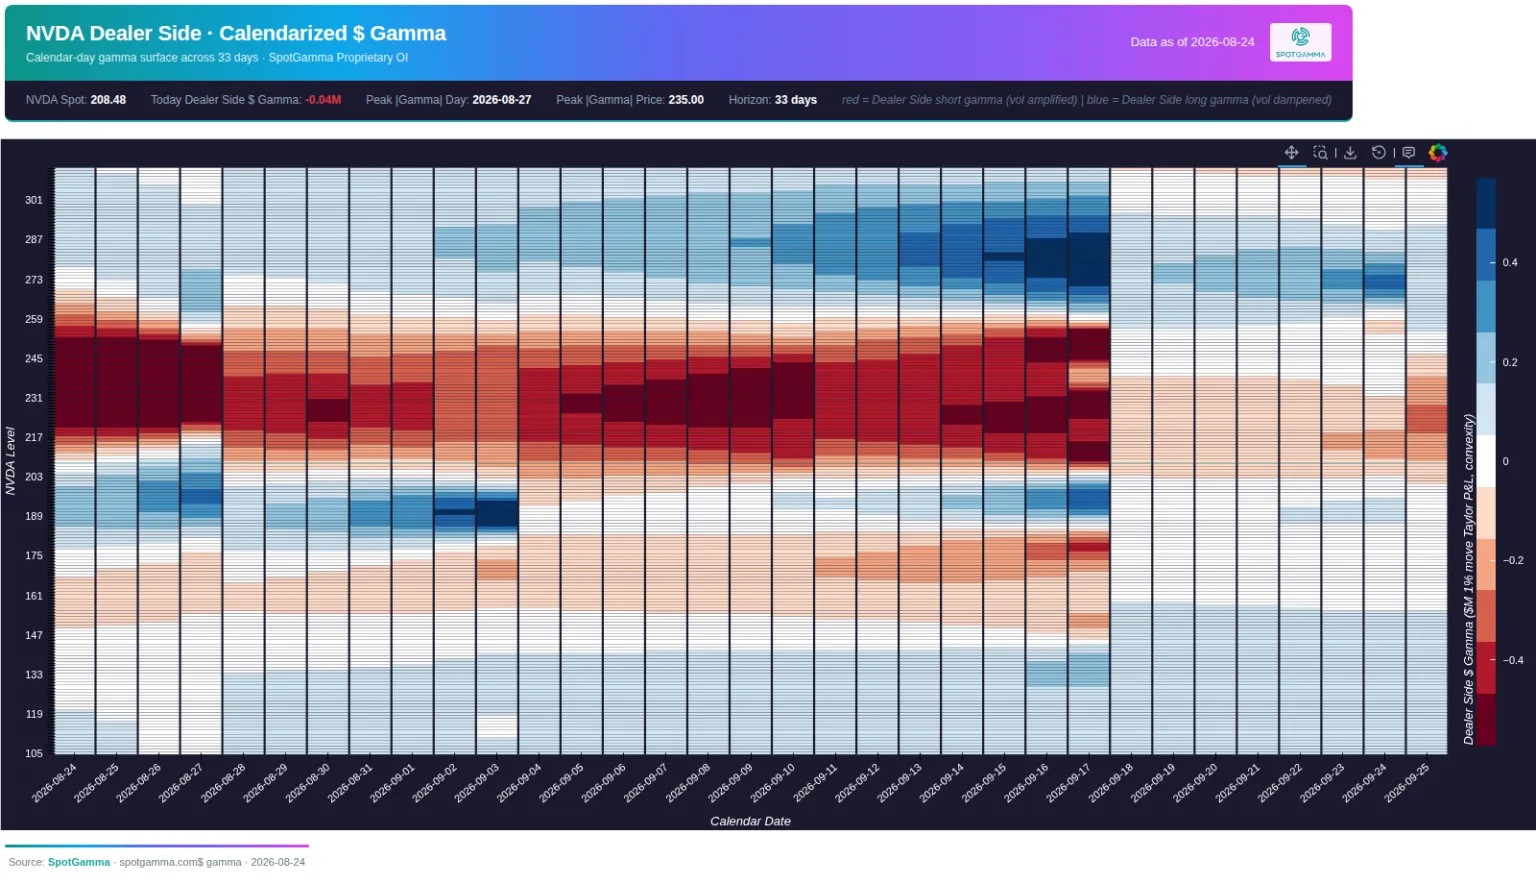
On the downside, that negative gamma is reduced into the 200 round number level as dealer exposure flattens out considerably, which would invoke some support in the 195-200 range, coinciding with where the stocks 200 day moving average sits just above 195.
It’s interesting to note that this view encompasses expirations through September 18th which is monthly OPEX and a large triple witching expiration for the markets. This could imply a trend move that begins after NVDA’s print could last into September OPEX.
Volatility Insights
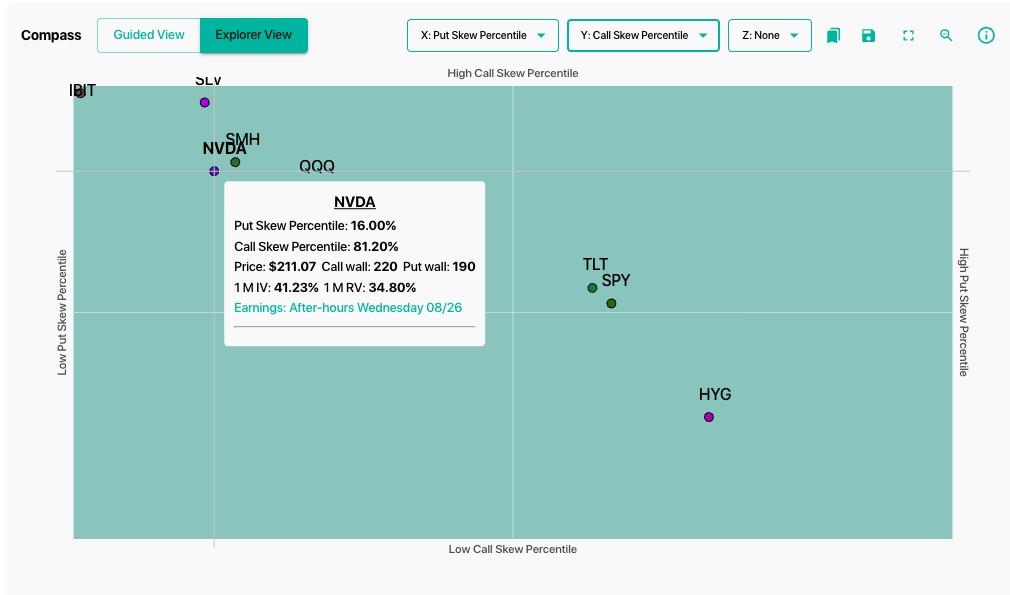
Call skew is at the 81st percentile while put skew sits at just the 16th percentile. This shows traders are pricing in any outlier move being more likely to the upside, not too unusual for an AI focused semiconductor company but notable for the largest name in the market as it tends to be harder to see an outlier upside move when the options market is pricing in that risk.
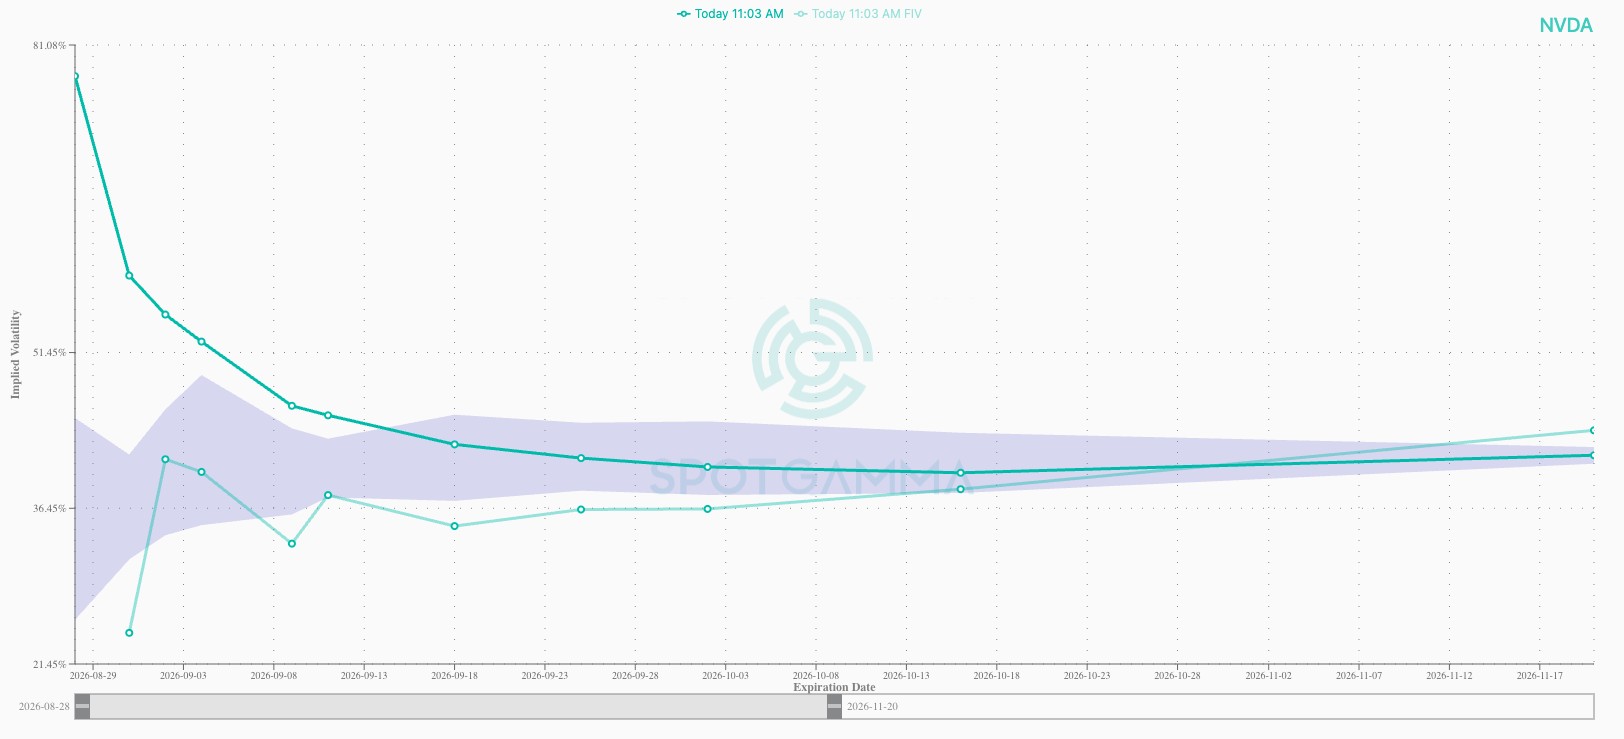
NVDA’s term structure is seeing the front two week expirations at a higher forward IV versus average due to the earnings event while options in October are more reasonably priced from an implied volatility perspective. This potentially offers up a good risk/reward for calendar spreads which take advantage of differences in IV between expirations, selling the near term juiced volatility and buying a longer duration option of the same strike price.
Setup to Watch: Call Calendars to Capture Upside
NVDA has a visible term structure distortion with August 28th near ATM IV approximately 82%, while September 4th is closer to 55% and September 18th monthly volatility is lower still near 45%. That opens an interesting trade idea using calendar spreads:
Short Aug. 28 premium / Long Sept. premium at the same strike.
For example, a trader expecting a moderate bullish reaction toward $220–230 could look at a 220 or 230 call calendar. The Aug 28th / Sept 18th $220 call calendar spread is priced at $2.75 debit and that is the max loss on the trade while a move higher into the 215-235 zone likely is profitable.
Calendars are positive theta and positive vega while short gamma, making them quite forgiving since delta exposure is not the only variable. The main advantage is a wider net of profit potential, as a strategy to use when expecting a contained move on a gap up to new highs. For this reason the current volatility term structure highlights a calendar spread setup into earnings instead of neutral plays like iron condors or any naked selling.