• Skip to main content
  • Skip to primary sidebar

SpotGamma™

S&P 500 Stock Market Gamma Trading Levels Based on Options Open Interest

  • About
  • Pricing
  • Academy
  • Resources
    • Tool Demos
    • Case Studies
    • Blog
    • Support Center
    • Daily Report
    • Free Trading Tools
      • Options Profit Calculator
      • SPX Gamma Exposure
      • Implied Earnings Moves
      • Volatility Ranking
    • Free Training
    • Report Card
  • Login

Jan 25 2024

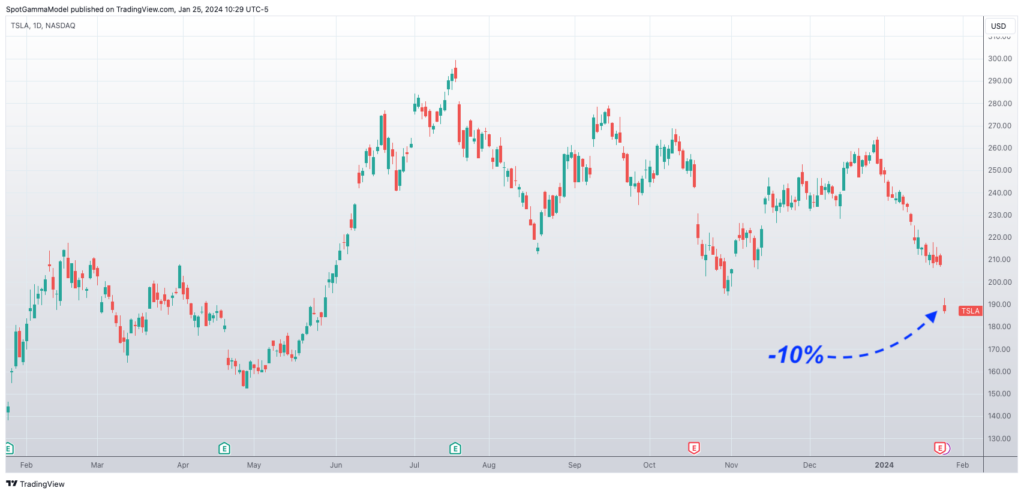
TSLA Volatility Falling Despite Being Down 10%

TSLA is down 10% after earnings, and our data is suggesting that if anything, TSLA options are now cheap!
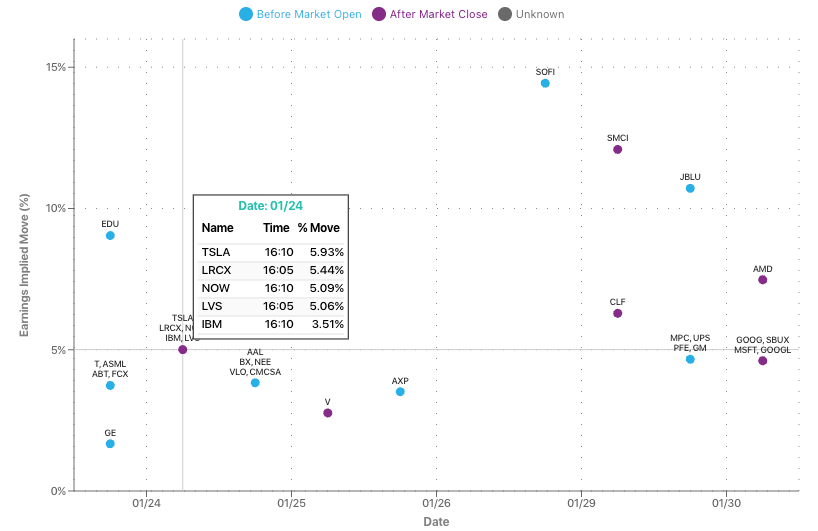
One would think that may lead to an increase in options implied volatility, as the implied move was just 6%. You can see this in the legend in our earnings dashboard, below. This shows us the earnings implied move based on pre-earnings options prices.
Based on fixed strike volatility, we see vols are down across the board. Here we show the change in implied volatility for each strike (x axis) across each expiration (y axis). The shade of red tells us that IV is down across the board.

This generally makes sense given earnings is out of the way, but it is a bid odd given TSLA’s stock is moving past its estimated earnings move.

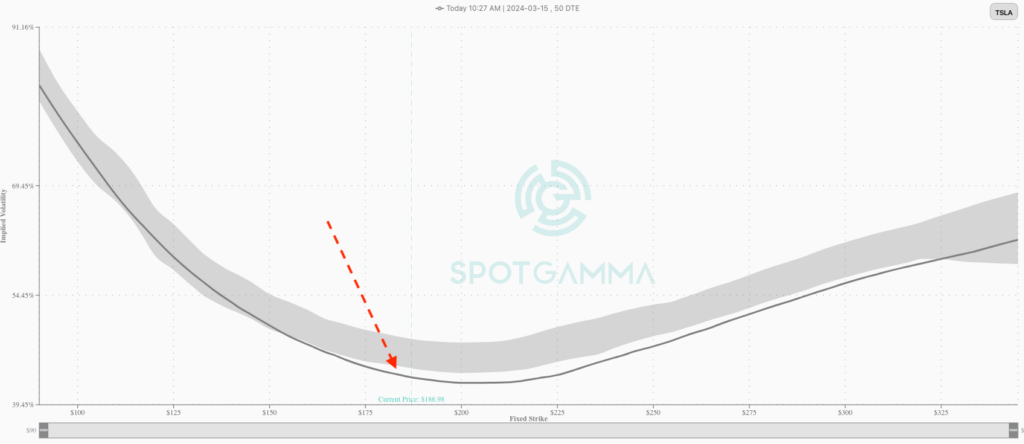
When we zoom in on a specific expiration, like with March skew below, we can see that current IV readings (gray lines) are below were volatility has been over the last 60 days (gray shaded area).

This informs us that options may be less expensive now than than have over the last 60 days.
Share This Article

  • Share
  • Twitter
  • LinkedIn
  • Reddit
  • Facebook

Written by SpotGamma · Categorized: Market Analysis · Tagged: earnings move, fixed strike volatility, implied volatility, TSLA

Don’t have an account with SpotGamma?

Choose the plan you want today to view unique support and resistance levels, access Founder’s Notes and expert commentary, daily trading ranges, and entrance into our private Discord.


Primary Sidebar

Related Resources

  • The S&P500’s Diversification Problem

    The S&P500’s Diversification Problem

    September 20, 2026
  • Quiet Oil Options Mask Tail Risk

    Quiet Oil Options Mask Tail Risk

    September 20, 2026
  • Celsius Insiders Are Buying the Dip — And Options Are Cheap Into the Catalyst

    Celsius Insiders Are Buying the Dip — And Options Are Cheap Into the Catalyst

    September 18, 2026
  • Trump Xi Summit and the Market Outlook

    Trump Xi Summit and the Market Outlook

    September 17, 2026
  • AI Stocks Options Positioning: Call Selling, Not Put Buying

    AI Stocks Options Positioning: Call Selling, Not Put Buying

    September 16, 2026
  • youtube
  • x
  • Privacy Policy
  • Disclaimer
  • Terms & Conditions
  • Support Center
  • Media
  • Contact Us

©2026 TenTen Capital LLC DBA SpotGamma

All SpotGamma materials, information, and presentations are for educational purposes only and should not be considered specific investment advice nor recommendations. Futures, foreign currency and options trading contains substantial risk and is not for every investor. An investor could potentially lose all or more than the initial investment. Risk capital is money that can be lost without jeopardizing one's financial security or lifestyle. Only risk capital should be used for trading and only those with sufficient risk capital should consider trading. Past performance is not necessarily indicative of future results. Testimonials appearing on this website may not be representative of other clients or customers and is not a guarantee of future performance or success.

View Full Risk Disclosure