Key Takeaway
SpotGamma believes traders should add long exposure via NDX/QQQ calls due to a potential rally in equities through mid terms which would couple with a potential increase in volatility. Both higher equity prices and higher volatility benefit call positions.
We prefer the tech-heavy NDX vs SPX due to a “diversification drag” the S&P500 may experience.
On July 7th we wrote an article about the record spread between Nasdaq & S&P500 volatility – a spread that signified risk for the Nasdaq due to massive tech gains into July.
These extremes in tech vols also drove significant highs in various volatility indexes, like the “DSPX – CBOE Dispersion Index”.
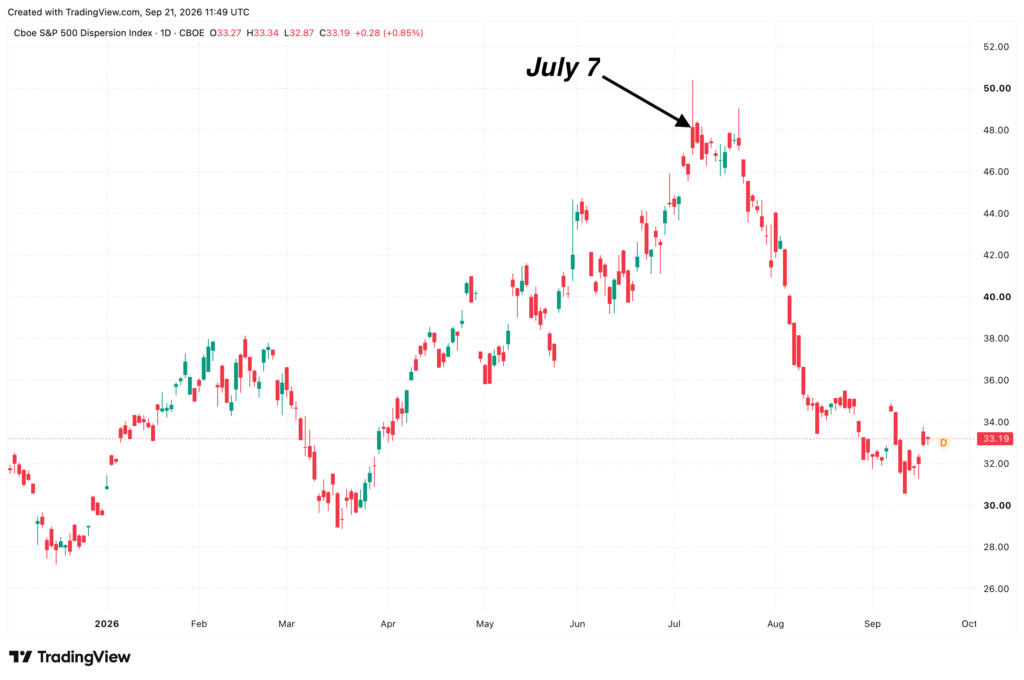
We had two conclusions from that original article – both of which have now played out.
The first point was that a near-term correction was due as the leaps in relative NDX volatility signaled unstable options positioning:
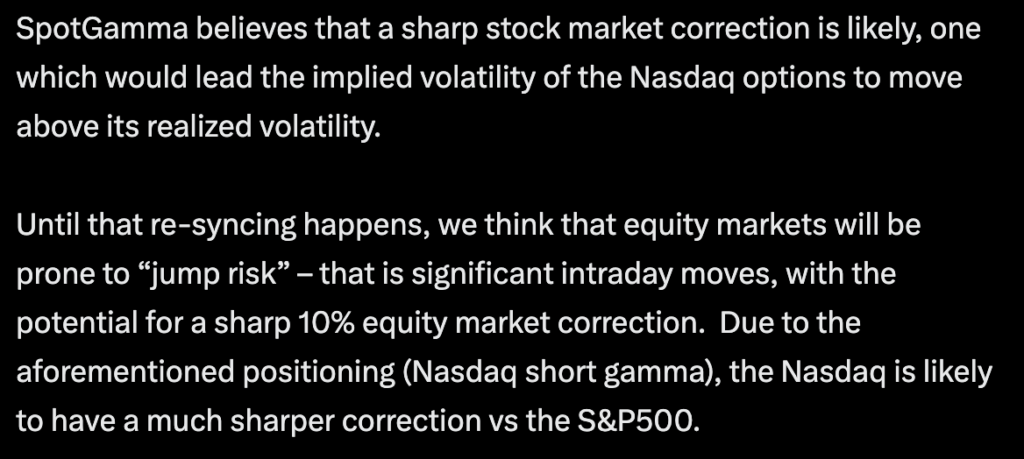
Excerpt from SpotGamma’s July 7 article on “Why Nasdaq Volatility Is Breaking Away from the S&P 500”
From the publishing of that article, the Nasdaq fell more than 8%, while the S&P500 had a much more benign 3% correction.
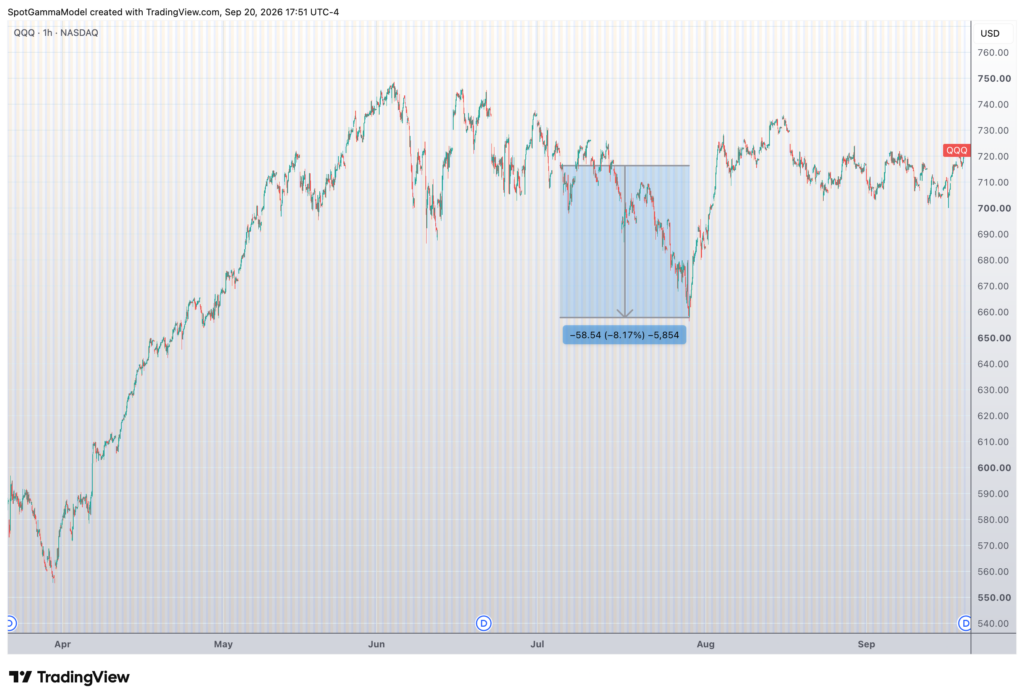
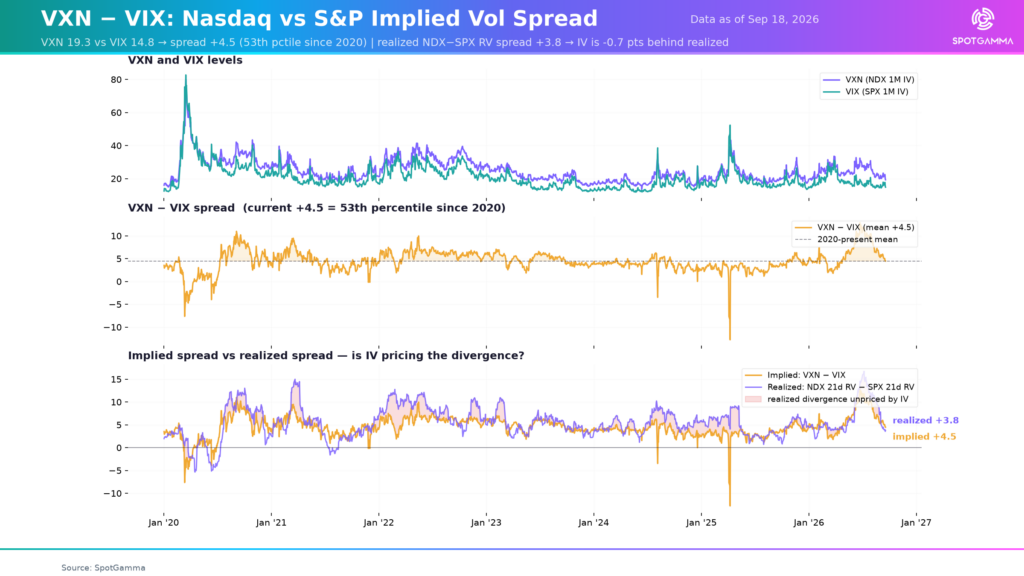
More importantly, the “re-syncing” of tech vols is largely complete, as NDX volatility has declined sharply despite downside price action.
Below is the VXN (Nasdaq Volatility Index) vs the VIX (S&P500 Volatility Index), which shows the spread between the VXN/VIX has returned to a long term mean. Since the spread has normalized, we argue that tech vols are back on stable footing. Further, as tech vols have come down sharply, options are now arguably cheap vs the extreme richness of July.
The second, longer term conclusion from the July article was that the Nasdaq was likely to carry a new, higher level of volatility than the S&P500 due to the growth of AI.
We argued that while generally investors associate volatility with risk, volatility can also be welcomed if it’s associated with upside price action.
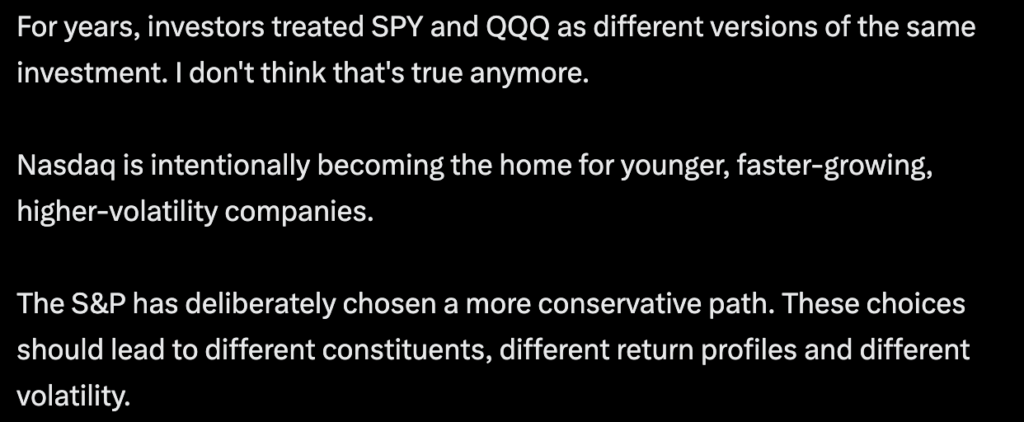
Quote from SpotGamma’s July 7 article on Nasdaq-S&P volatility correlation breaking apart.
This second argument has now hit a critical crossroads.
As more economic growth is driven by gains in AI, the Nasdaq could continue to see faster price appreciation vs other major US indices. Further, as we discussed in our original article, the changing of the Nasdaq methodology in June allowed for the fast-tracking of major new listings such as Anthropic, which is set to IPO in November.
The S&P500’s Rising Inverse-Beta Weight
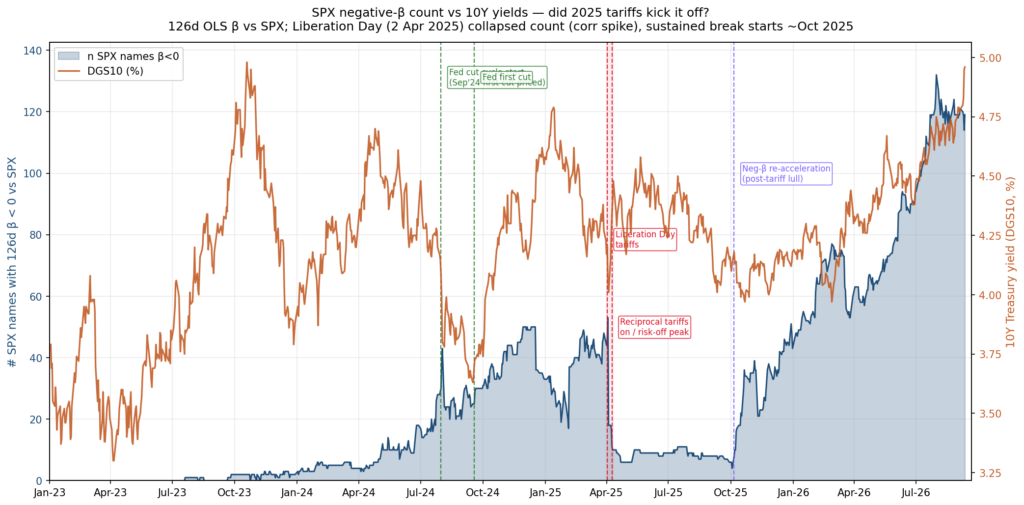
Over the last several weeks, the S&P500 has seen a record increase in negative-beta amongst its constituents – that is 119 components of the S&P have price action that moves inversely to the Index itself. You can see the increase in these components in black, below, which now account for 24% of the S&P500’s weight. Methodology note: we measure each constituent’s beta to the Index over a trailing 3-month price window; “inverse” components are those whose beta has turned negative, and as the industry breakdown below shows, oil- and rate-linked sectors account for much of that weight.
Also plotted is the US 10-year rate (orange), which is simultaneously making new highs. It is this rate issue, being driven in large part by oil, that is creating the negative beta phenomenon.
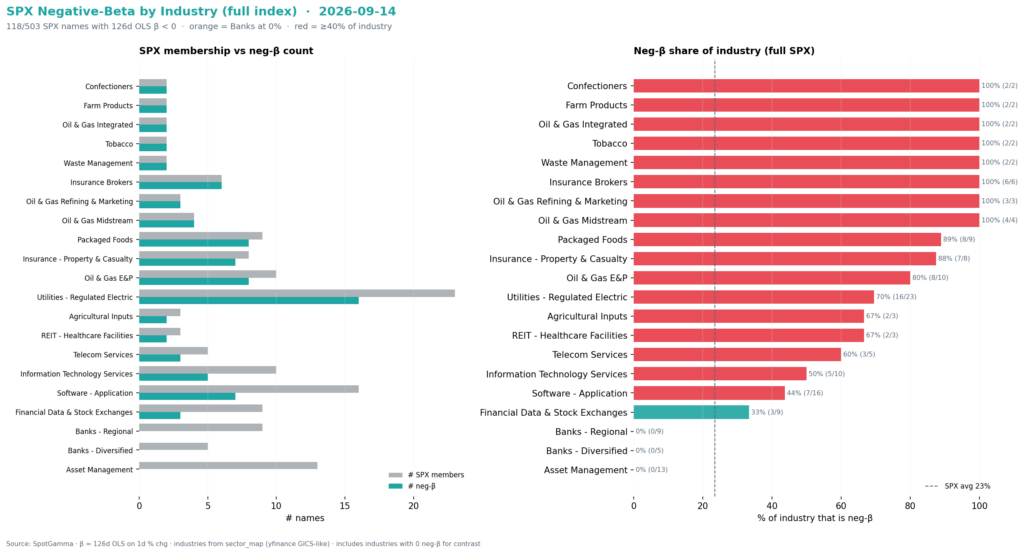
Because of higher oil prices and higher rates, sectors like energy, insurance and utilities have decoupled from positive S&P beta. In this case, as oil prices have increased, energy stocks in the S&P500 have made gains while the Index declined.
This diversification allowed the S&P500 to outperform the Nasdaq by 1.5% since our July 7th note. This outperformance was because as oil/rates went higher, sectors like energy outperformed. The Nasdaq 100 contains just 2 energy names: BKR & FANG.
Further, the less tech-heavy S&P500 declined less in the July tech-vol unwind.
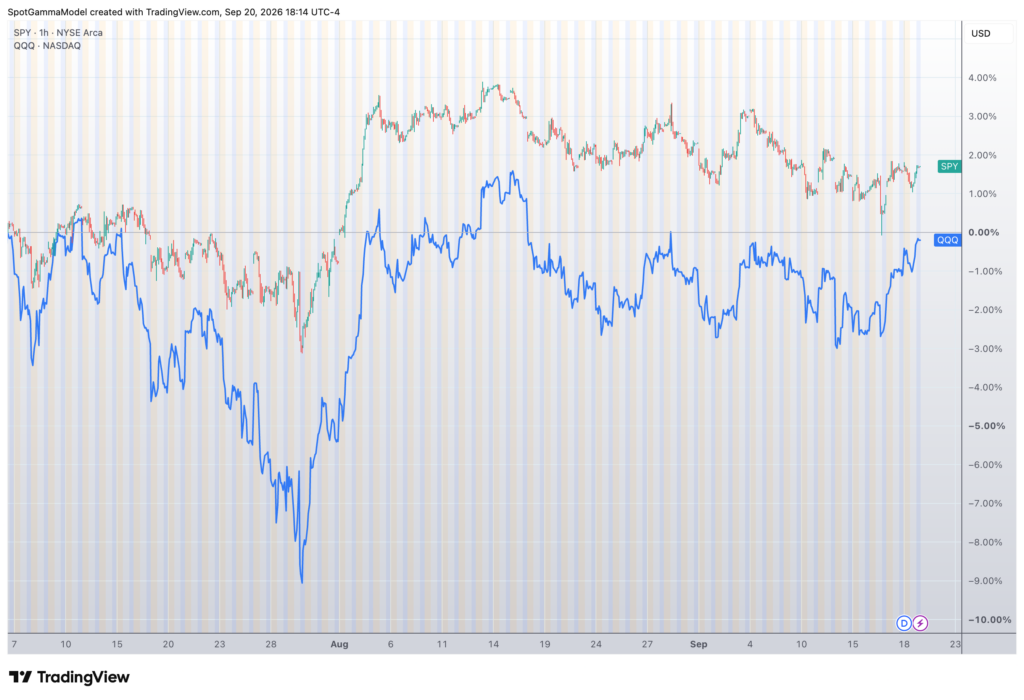
That was diversification working in the S&P500’s favor. The problem is what happens when the tape flips: over the last several sessions oil prices have slid from $105 to $95 (bottom pane). Over that same period, the Nasdaq (candles) outperformed the S&P (blue) by 1.5%.
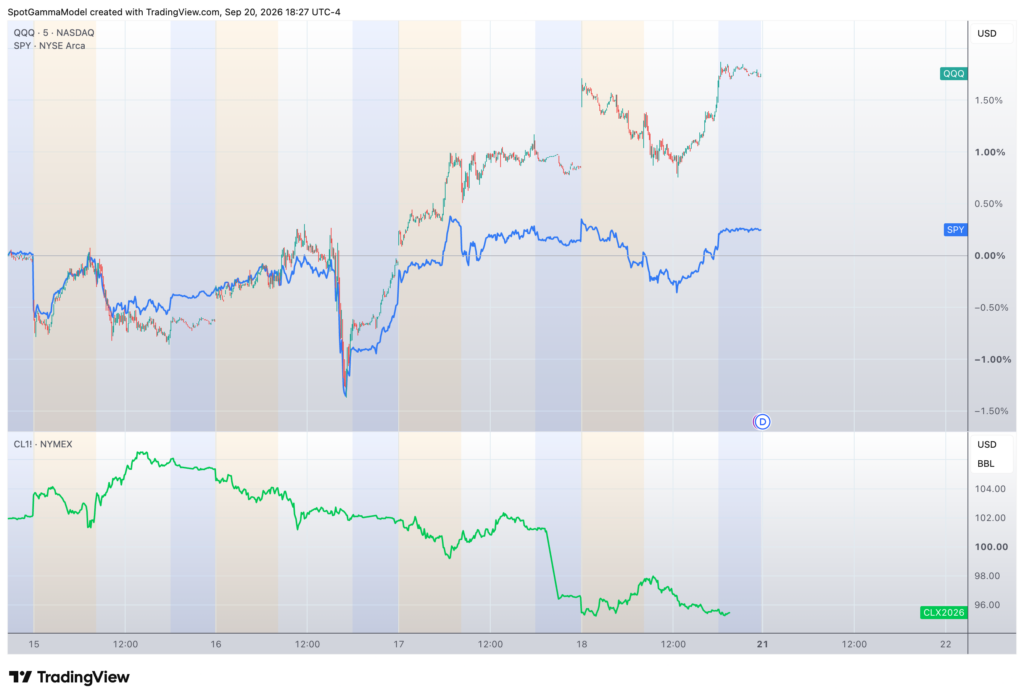
This highlights the diversification problem: if oil & rates move lower/flat then large components of the S&P500 may slide lower, which is a tax on Index performance. Meanwhile, the technology index has much less of an oil/rate tax – and has adjusted constituency to concentrate in the leading sector for economic growth, which may give it significantly more torque in future bull markets.
The Price of Volatility
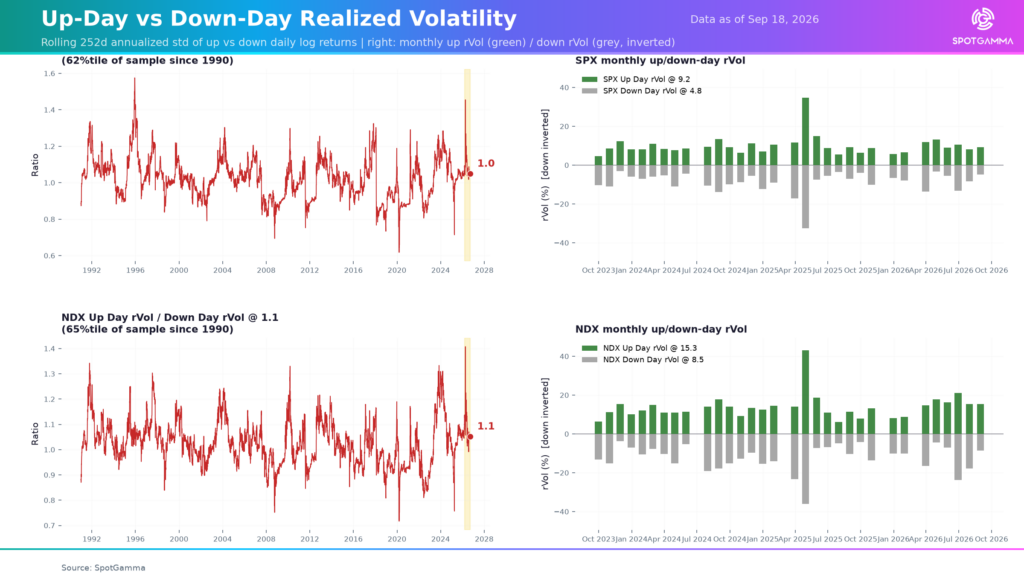
Nasdaq volatility is increasingly expressing itself to the upside. NDX remains structurally more volatile than SPX, but over the trailing year its upside realized volatility has exceeded its downside realized volatility by roughly 10%, an asymmetry stronger than we’re seeing in SPX.
Our data shows that, in absolute terms, NDX’s current up-day realized vol is ~66% higher than S&P. We suspect this spread may only increase if oil and/or rates drop, with the November Anthropic IPO as a secondary catalyst.
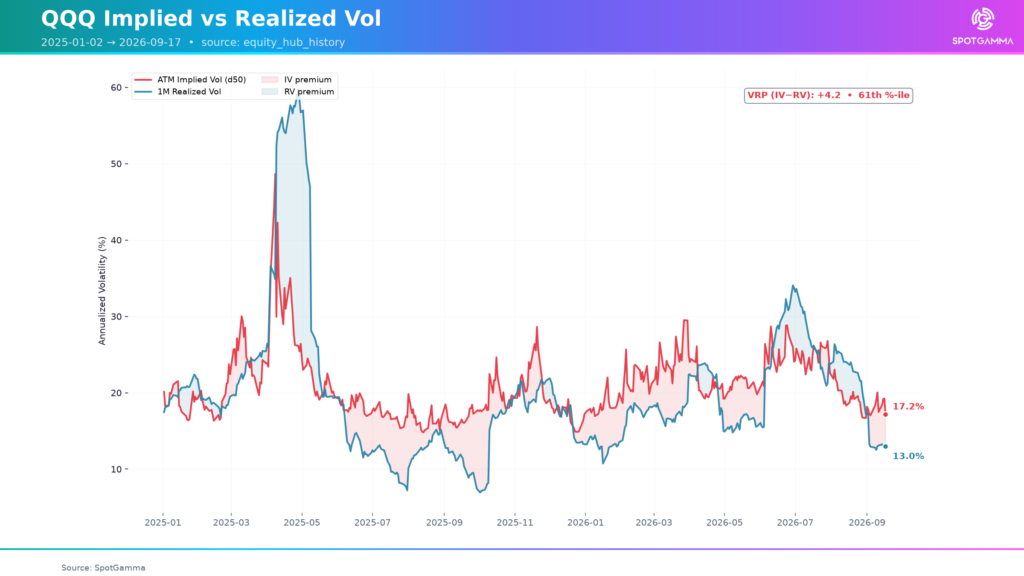
Meanwhile, both the S&P500 and Nasdaq have currently reached 1-year lows in realized volatility (blue). Accordingly, 1-month implied volatility (red) is also back near 1-year lows – signaling that options may be cheap. This, despite the Midterm catalysts and additional volatility added due to the Iran war.
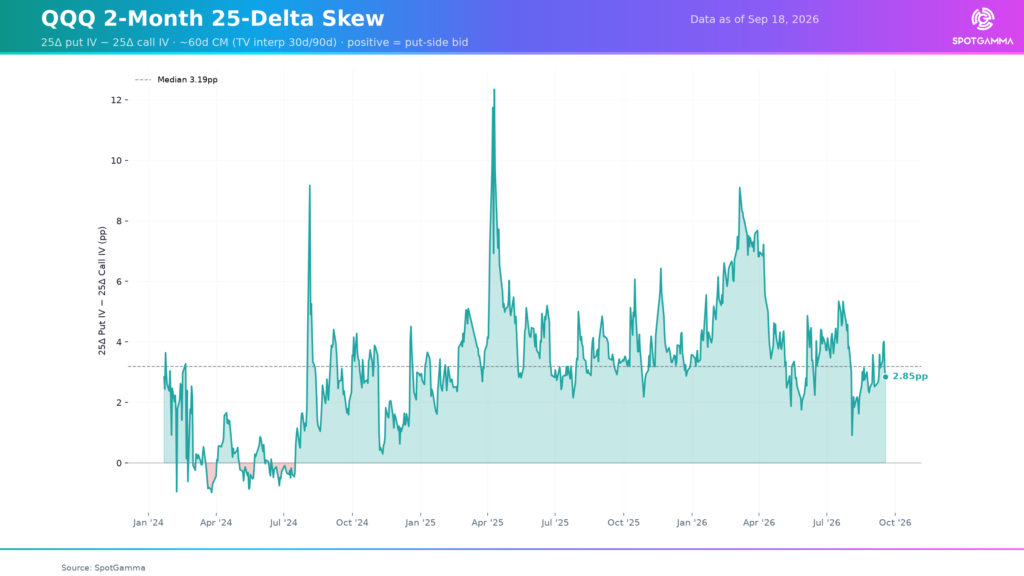
Further, ahead of the key Midterm catalyst in November, we see that NDX (QQQ as a proxy) November call skew is also near 1-year lows – a signal that upside calls are relatively cheap.
While it is true that the S&P500 shows a similarly low implied volatility, we argue that if equities resume their bullish trend, the Nasdaq is more likely to express upside price appreciation through higher volatility – which benefits long call positions.
The bottom line: if oil and rates stop rising, the S&P500’s inverse-beta block turns from hedge to tax on the Index. The Nasdaq carries no such drag – it is concentrated in the market’s growth engine, and its upside volatility remains cheap.