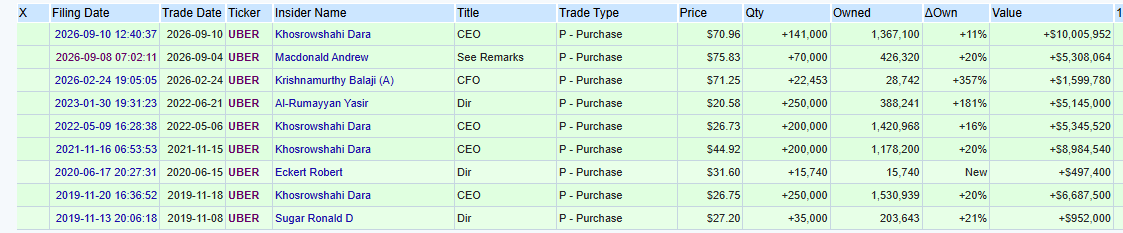
UBER saw a notable insider buy on 9/10, with its CEO scooping up stock at just under $71 per share. That followed another executive who bought a week earlier at even higher prices, and back in February the company’s CFO purchased $1.6M in stock at $71.25.
The stock continues to lag the broader market, currently down about 15% year-to-date and trading nearly 30% below its October 2025 closing high of $100. Over the past six months however, UBER has essentially formed a base between 70 and 75. The insider buying suggests company leaders see value at these levels.
Fundamentals: The CEO’s purchase reinforces a credible value proposition.
Dara Khosrowshahi bought 141,000 shares on September 10 at an average $70.9642, spending approximately $10 million. That increased his reported direct holdings by roughly 11.5%. With UBER around $72.50 near Monday’s close, investors are paying only about 2% above his purchase price. This was a stock purchase, not a compensation award. Also notable is that it was the first open market purchase for the CEO since May 2022 as the table below shows all insider buys for UBER going back to 2019. (Source: OpenInsider)
The operating results support that confidence. Second-quarter gross bookings increased 24%, trips rose 18%, and GAAP operating income grew 30% to $1.9 billion. Revenue increased 12%, with business-model accounting changes reducing reported growth by eight percentage points. Quarterly free cash flow reached $2.8 billion.
At current levels, Uber trades around 14.6 times trailing free cash flow, equivalent to a 6.9% cash-flow yield. Using consensus 2027 adjusted EPS of $4.41, the stock costs approximately 16.4 times next year’s earnings. Those are appealing multiples if Uber sustains growth and converts it into cash available to shareholders.
The central risk is autonomous vehicle economics. Uber’s reported $10 billion robotaxi commitment could strengthen its distribution platform, but fleet investments and competition could also absorb cash and pressure margins. Reported free cash flow does not deduct every acquisition or equity investment. The investment case depends on how much cash ultimately remains available for shareholders. (Source: Financial Times)
Options: Moderate volatility, a meaningful trading range, and little downside skew.
One-month implied volatility is approximately 35%, versus 33.4% realized volatility over the past 20 sessions. That modest premium suggests options are reasonably aligned with recent movement; the data does not show an unusually large premium for uncertainty.
Using at-the-money call-plus-put midpoint prices, options imply these approximate moves around the current $72.24 stock price:
| Expiration | Implied move | Reference range |
|---|---|---|
| September 18 | ±$2.43 / 3.4% | $69.81–$74.67 |
| October 16 | ±$6.00 / 8.3% | $66.24–$78.24 |
| November 20 | ±$9.85 / 13.6% | $62.39–$82.09 |
These are straddle-based movement estimates, not directional forecasts or guaranteed 68% probability bands. November spans the next estimated earnings date, November 3; its move covers the entire period, not just the report.
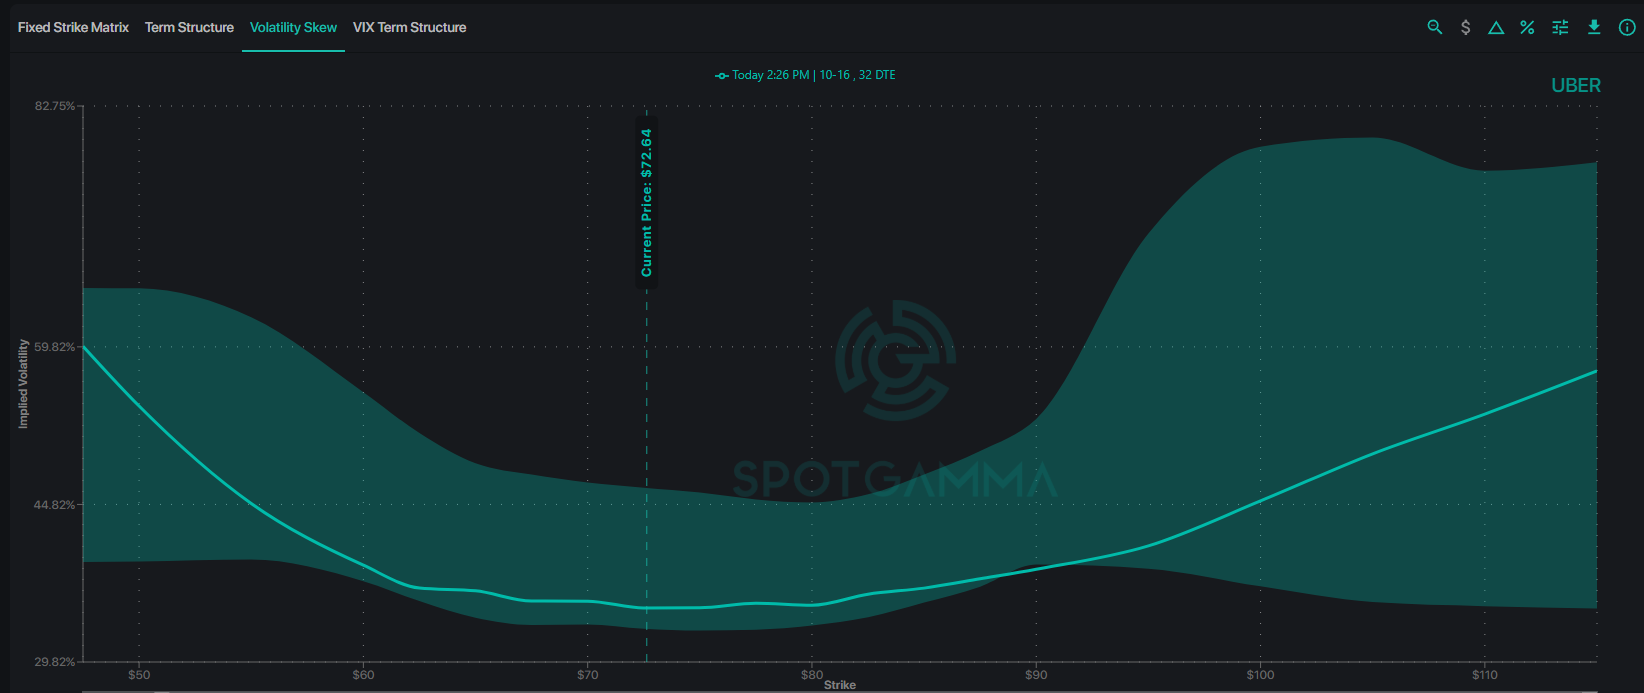
Skew is nearly flat. Comparing equal-magnitude 25-delta puts and calls, put IV minus call IV is approximately −1.0 volatility point for September 18, −0.2 for October 16, and +0.3 for November 20. Short-term upside calls are slightly richer; November has only a small downside premium. That is consistent with balanced pricing and some interest in a rebound, although skew cannot establish whether traders are buying calls or selling puts. Looking at the SpotGamma vol skew chart below shows that flatter skew for October and November. IV Rank is also relatively low at 15, signaling lower volatility in the options market compared to the past year. The options market is simply assessing fair value to the stock at these levels.
The SpotGamma synthetic OI model shows plenty of supportive positive gamma in this range between 69-73 and a steady decrease of that gamma above 75. UBER shows more negative gamma above 80 which would potentially create a more fluid trend shift higher if prices sustained above that level.
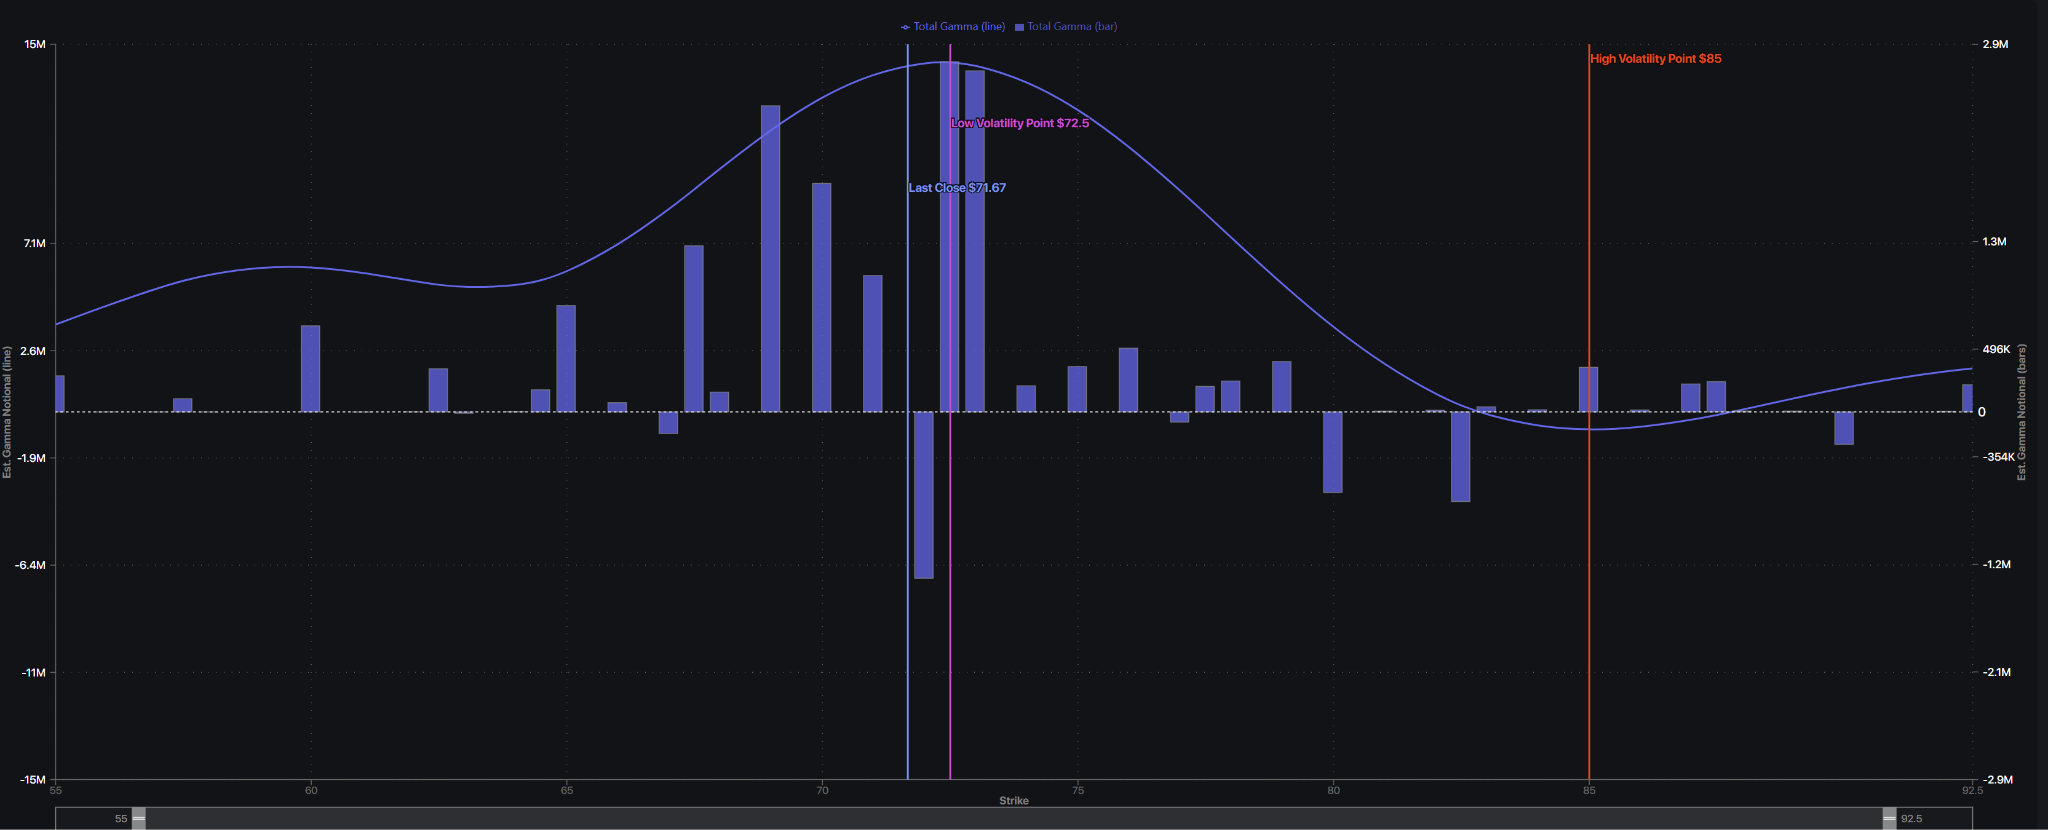
For a bullish investor, this supports considering shares or a defined-risk call spread while watching $69.24 and $74–76. November call spreads would capture its next earnings event due early that month.
Technicals and analyst sentiment:
Wall Street sees upside with bullish price targets but the chart remains in repair.
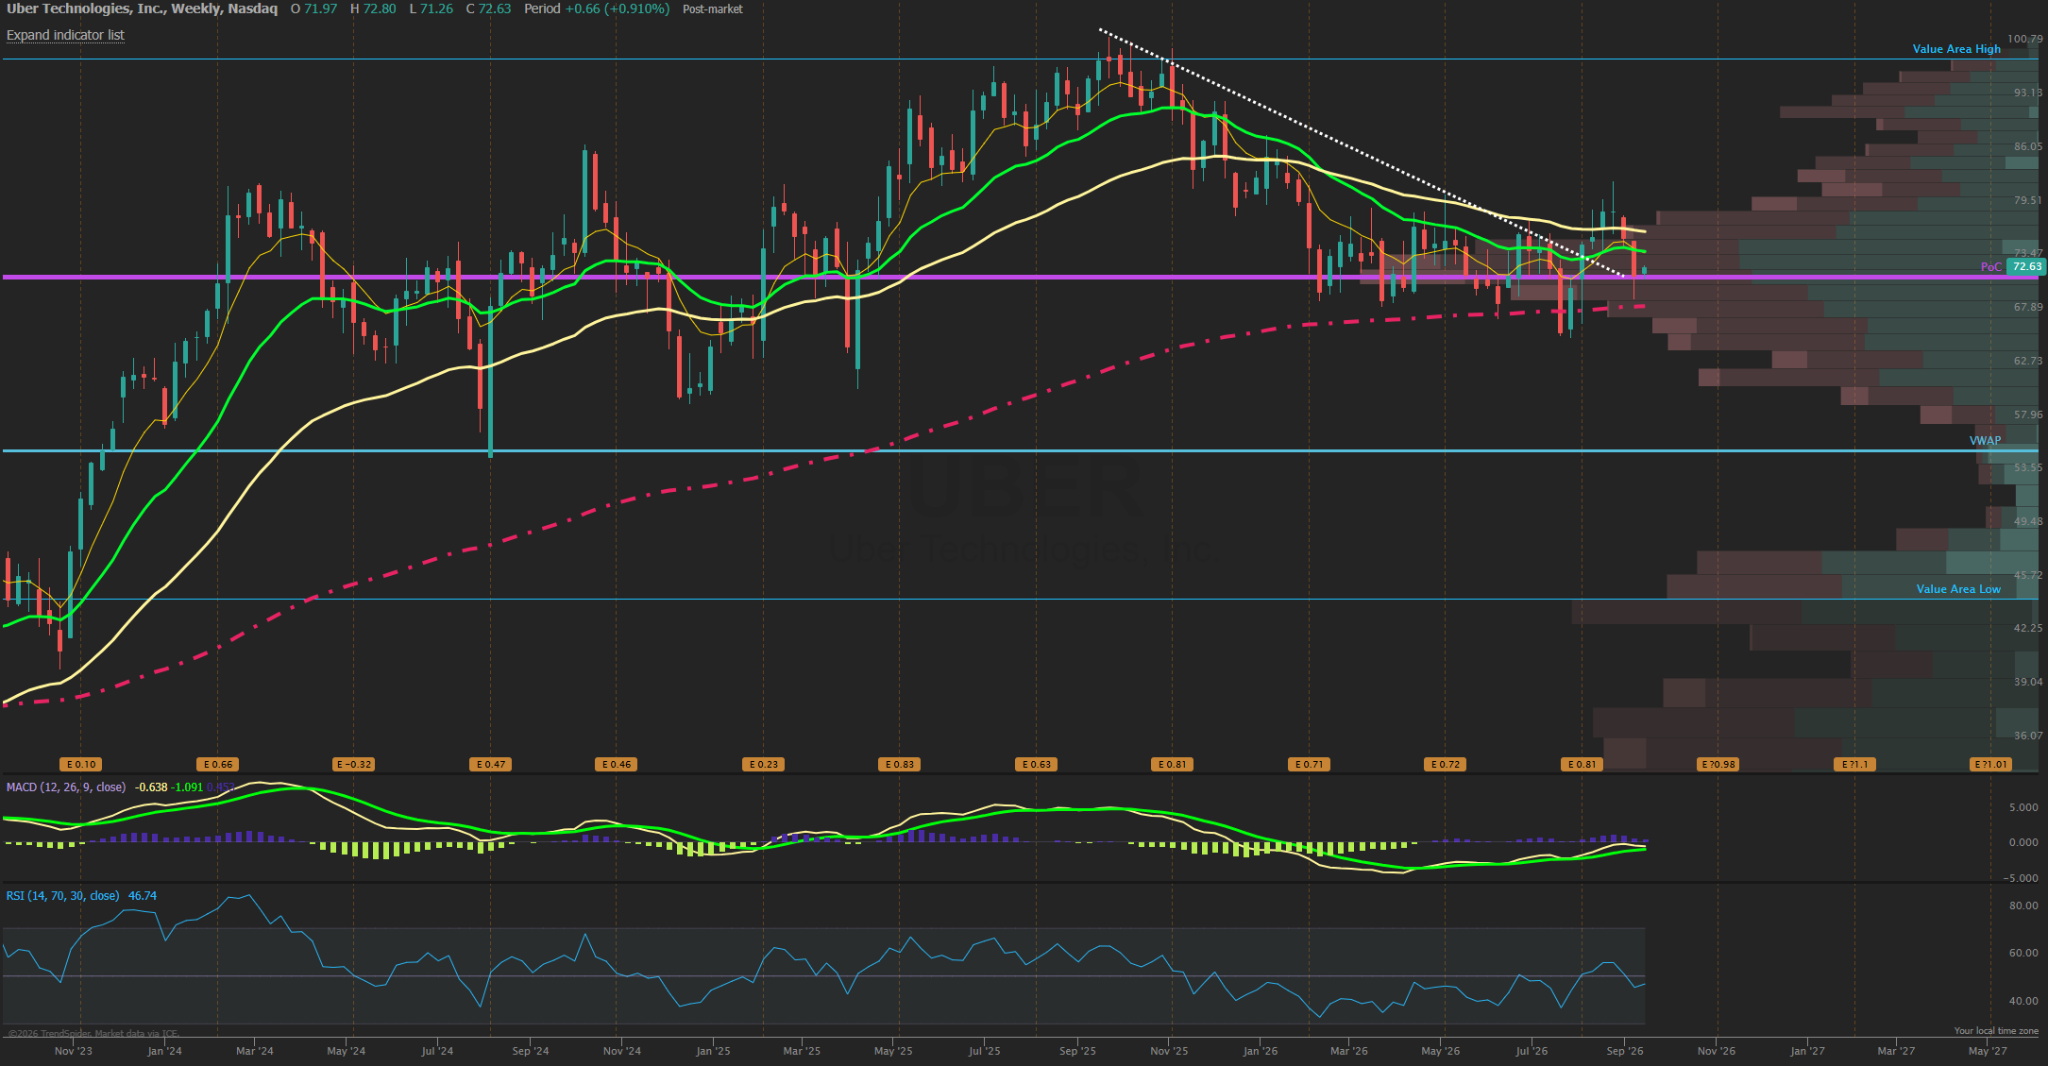
UBER sits below its 50-day moving average near $73.88 and 200-day average near $75.97. Its RSI near 44 indicates weak momentum without an extreme oversold reading. A sustained recovery through $74–76 may be evidence that buyers are regaining control.
The immediate area to watch is $70–71, around the CEO’s purchase. The September 10 low of $69.24 provides a more concrete reference: a close below that level would weaken the developing rebound. Holding this area and reclaiming $76 would improve the setup for a recovery toward $79–80. These are my technical interpretations of the recent price history.
The weekly price chart below shows the stock oscillated around its key volume profile point of control at 72 which represents the most traded price band since back in 2021. The 200 week moving average also comes in at 68.50 and is a long term trend support often for growth stocks.
Analyst coverage remains broadly constructive. The consensus rating is Buy, with an average 12-month target of $102 approximately 41% above current levels. Recent calls include Bernstein maintaining $95 and Scotiabank initiating at $100, although Arete downgraded to Hold. The $70–150 target range shows substantial disagreement about Uber’s future economics.
Our interpretation: there is considerable potential upside if execution holds, but widespread analyst optimism also means bullish sentiment alone is unlikely to provide a fresh catalyst. Options skew is flat while the overall volatility landscape is quiet, potentially allowing for longer term investors to add calls as a synthetic substitute for holding stock. Based on the CEO insider buying, subdued options pricing, and the recent correction in share price now back to supportive levels, it warrants a more careful look at the upside potential in this autonomous rideshare sleeping giant going into year end.