A series of major market catalysts arrive next week: the FOMC rate decision, VIX Expiration, and September Triple Witching OPEX. Options positioning suggests that institutions are already paying up for event protection.
Over the past two weeks, we have observed notable VIX hedging activity in our daily FlowPatrol reports. This included several particularly significant positions:
- 140K Oct. 28 calls bought to open for $0.92
- 128K Nov. 31 calls bought to open for $0.94
- 143K Nov. 34 calls bought to open for $0.89
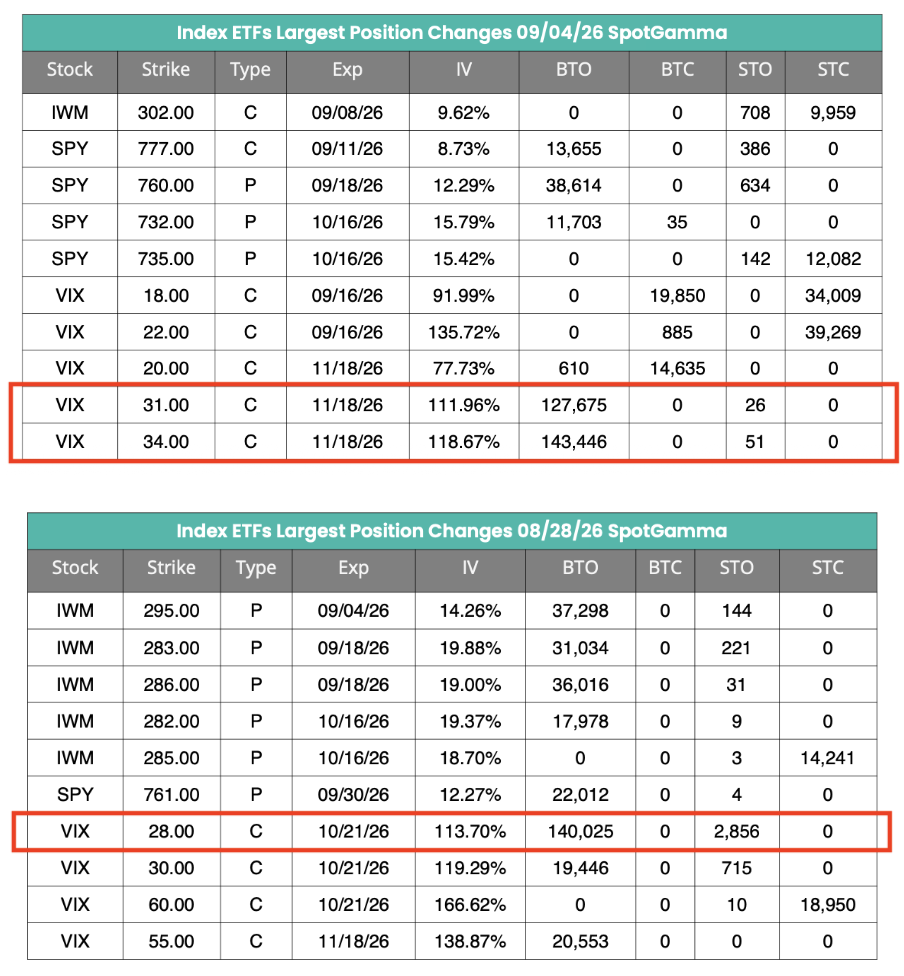
While index long puts were also present as hedges, the unusually large size and far-OTM strikes of these VIX calls stood out as unusual. This raises two questions: What are these traders hedging against, and why might they choose VIX calls instead of SPX puts?
FOMC Creates Binary Event Risk
As of now, it appears that the FOMC decision next Wednesday has two possible outcomes that the options market is bracing for. A rate hold could ease pressure from yields and rate volatility, potentially acting as a clearing event for a volatility release. Conversely, a rate hike could lead to rising bond volatility and further pressure on stocks.
According to CME FedWatch, the probability of a Fed rate hike is 87% at the moment, suggesting elevated event risk for the equity market.
Moreover, September’s Triple Witching OPEX next Friday will be a massive liquidity event, with ~$2 trillion of delta notional set to roll off. This clearing could act as a catalyst for a shift in the market’s current volatility regime. For more information on next week’s event risk, catch SpotGamma Founder Brent Kochuba’s hour-long session with Excess Returns from last week.
Why VIX Skew Looks Like a “Half Frown”
To understand the difference in potential PnL for VIX calls versus SPX puts, one must consider how these vehicles differ.
For most stocks and indices, implied volatility tends to increase as strikes move farther away from the current underlying price, particularly on the downside. Across the full range of strikes, this can produce what is commonly referred to as a volatility skew “smile.”
However, VIX options instead show a considerably different shape, given the nature of VIX as a volatility index. Instead, the IV vol skew curve forms a “half frown” for VIX options.
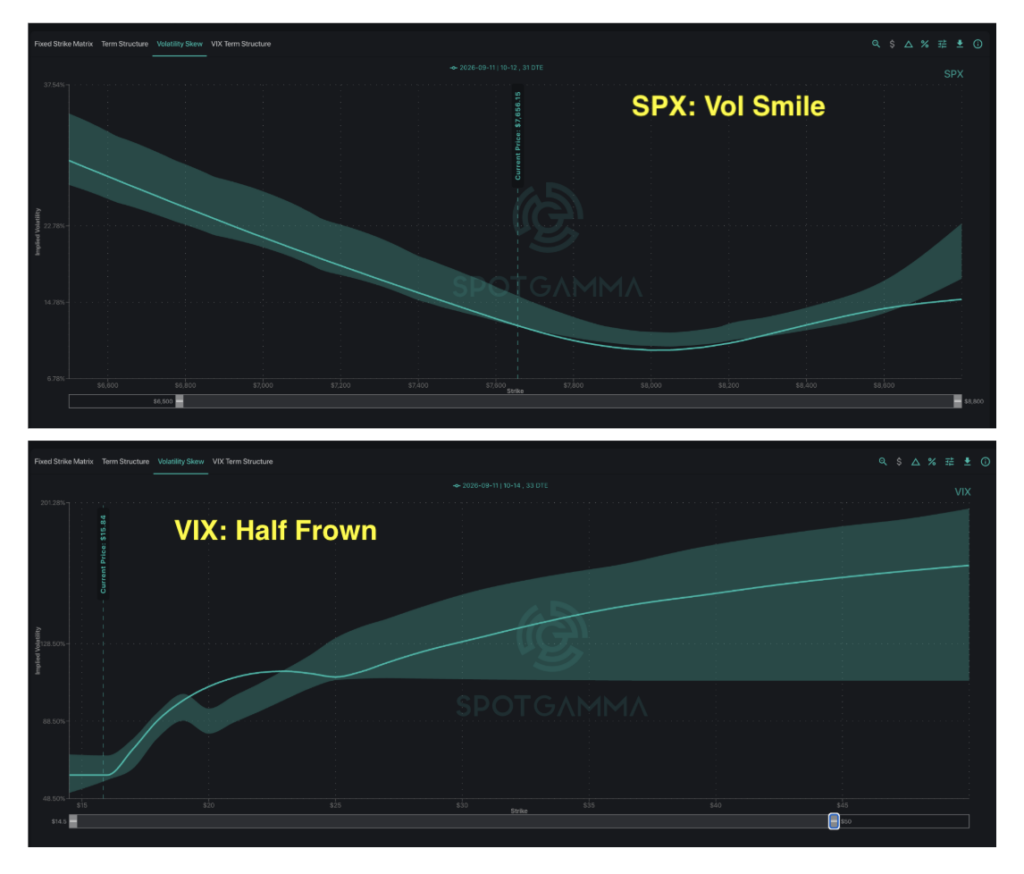
As an index of volatility itself, VIX sees IV fall quickly at lower strikes, while higher strikes carry progressively higher IV. For SPX, IV grows nearly linearly to the downside. For VIX, the IV slope eventually begins to flatten.
That upward-sloping skew reflects persistent demand for VIX upside — the same demand visible in the FlowPatrol prints above — and it shapes what buyers pay for crash protection.
Same Budget, Two Very Different Hedges
The differences between SPX puts and VIX calls raise practical questions for anyone carrying long equity exposure into a major macro event. SPX puts are a more delta-sensitive hedge, while VIX calls remain sensitive to changes in implied volatility. The preferred choice of hedge comes down to the risks each structure is designed to capture.
Long SPX puts expose the trader to two important forces at once:
- Delta: The option’s sensitivity to changes in the index price, which adds value as SPX falls
- Vega: The option’s sensitivity to changes in implied volatility, which adds value as implied volatility rises.
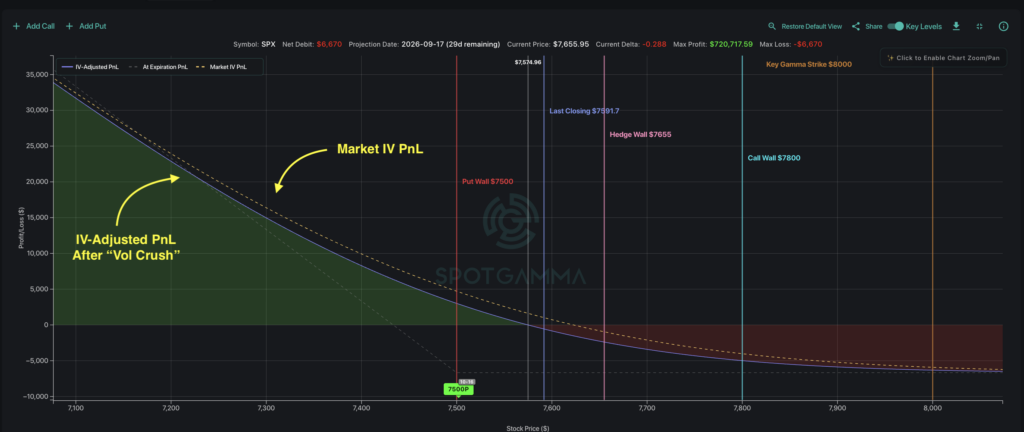
The challenge for SPX put buyers remains volatile-but-directionless sessions. Even throughout major events, realized volatility — how much the underlying price actually moves — can compress intraday as SPX ultimately finishes near unchanged.
In a low close-to-close realized volatility scenario, SPX puts can lose value from theta decay and may then face a post-event “vol crush,” as implied volatility reprices lower once market uncertainty resolves.
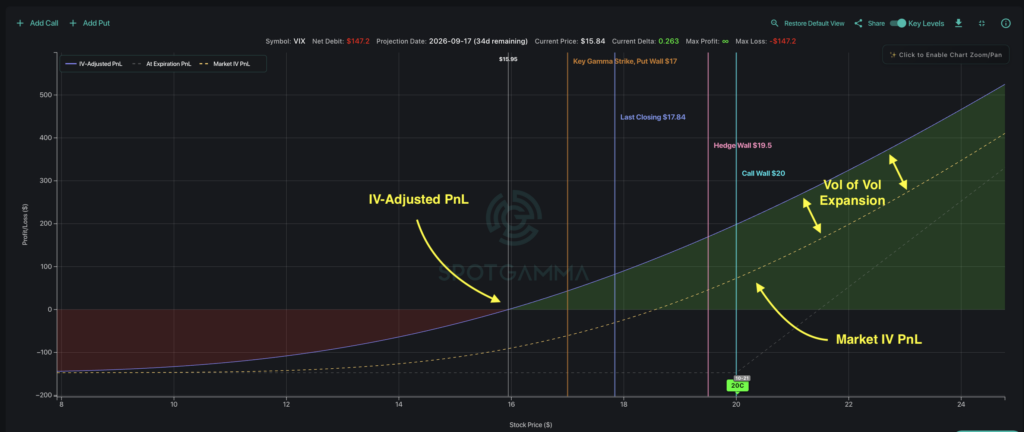
VIX calls behave differently, as the VIX itself reflects the pricing of roughly 30-day SPX implied volatility. As a result, VIX calls provide more direct exposure to a sharp expansion in SPX implied volatility rather than requiring a specific downside move in SPX.
That structure gives them a highly convex payout: modest cost in calm outcomes, and potentially explosive gains in a sudden panic. Remember that VIX itself is typically ~5x more volatile than SPX, which means VIX calls serve as a strong hedge against a volatility spike.
The trade-off becomes clearer in a side-by-side example using comparably-priced options: consider hedging 1,000 SPY shares, representing roughly $765K of notional exposure.
One SPX October 16th 7,500 put (~30 delta) costs approximately $6,650 in premium, as of Friday’s pricing at the close. Alternatively, roughly 45 VIX October 21st 20-strike calls (~38 delta) cost a comparable ~$6,650. The premium outlay is similar, but the payout profiles are very different.
Within a ±1% FOMC-day move — which is roughly what the options market is pricing — the two hedges behave differently:
- On a 1% decline, the SPX put gains $2,467, while the VIX calls recover ~$1,200.
- On a 1% rally, the put loses ~$3,200 as the move and post-FOMC IV crush compound, while the VIX calls lose roughly $1,500.
In either scenario, the VIX call moderates the outcome compared to the SPX put, with half the gain in the 1% decline and one third the loss in the 1% rally.
None of this serves as a financial recommendation. Rather, the comparison highlights how different hedging instruments can produce very different outcomes for the same budget.
Ahead of major event risk this next week, those looking to hedge index movement should understand what forces are driving their trade. Knowing whether a hedge is primarily exposed to market direction, implied volatility, or some combination of the two can help traders better define and manage risk.