• Skip to main content
  • Skip to primary sidebar

SpotGamma™

S&P 500 Stock Market Gamma Trading Levels Based on Options Open Interest

  • About
  • Pricing
  • Academy
  • Resources
    • Tool Demos
    • Case Studies
    • Blog
    • Support Center
    • Free Daily Report
    • Free Trading Tools
      • Options Profit Calculator
      • SPX Gamma Exposure
      • Implied Earnings Moves
      • Volatility Ranking
    • Free Training
    • Report Card
  • Login

May 11 2021

ARKK Gamma & What’s Really Behind The QQQrash? Nomura Gamma

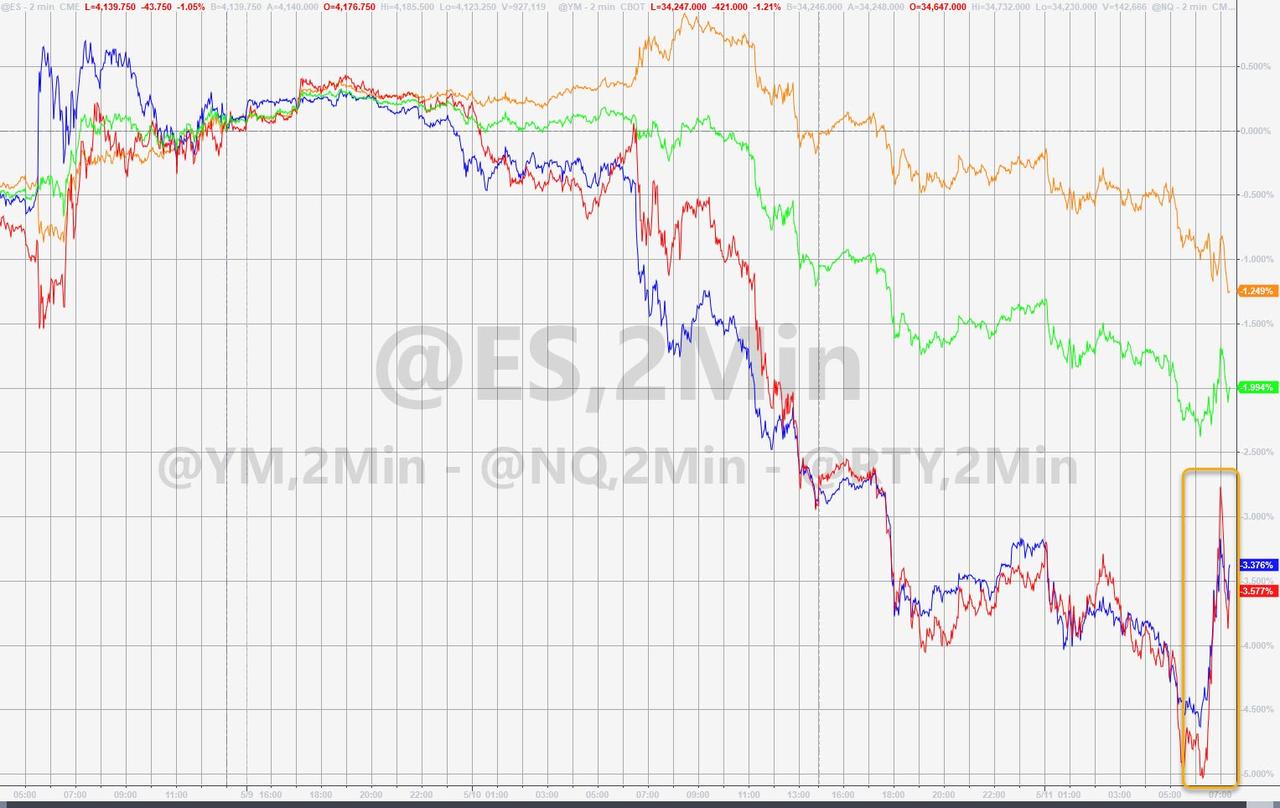
From ZH:

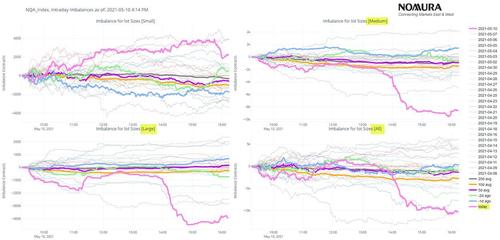
Nomura’s “futures imbalance” monitor showed enormous sell pressure all day in NQ futs across all lots sizes (the largest in at least 1m), but particularly in our medium- and large- lot buckets, proxies for large HFs and Asset Managers aggressively selling / shorting…
Two things were behind the QQQcrash – ARKK’s vicious circle and CTA Deleveraging.

Nomura’s Charlie McElligott warns that the monstrous ~$20B ARKK active ETF is getting absolutely torched in recent weeks amid a negative feedback loop from the mega-high growth / high multiple / “unprofitable” single-names.

Critically, he explains, the ETF itself now acting “shadow leverage” pressuring this selloff, especially with their dubious risk management practice of heavily concentrated positioning into what are extraordinarily illiquid names.

Along with the inherently-extreme interest rate sensitivity within these hyper-growth / high-valuation names, this has made ARKK a popular downside play / hedge in the options space, with Dealers essentially max “short Gamma” near this current $98-100 level, while net Delta across options is ~ $-2B and essentially the low net Delta reading since start 2020.
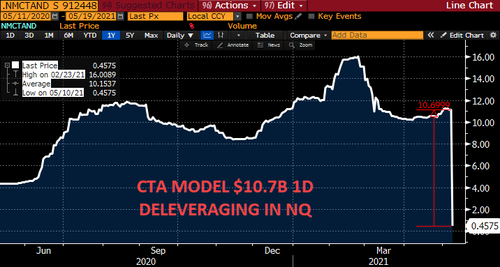
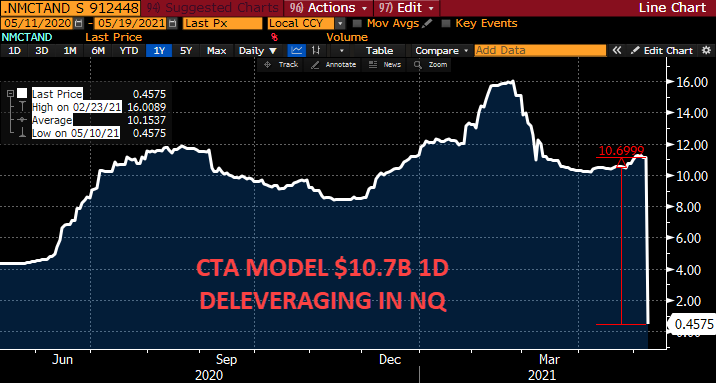
But that is not the only driver of the chaos as the Nomura QIS CTA Trend model showed massive deleveraging in Nasdaq yesterday into the down move after the 3m window “sell trigger” was breached and flipped “short” (now joining the 2w and 1m windows as “short,” although neither of those has any signal loading), which overall turned the multi-year legacy “+100% Long” signal across all horizons down to just “+4.1% Long,” and implying ~$10.7B of notional selling in NQ futs in the deleveraging.

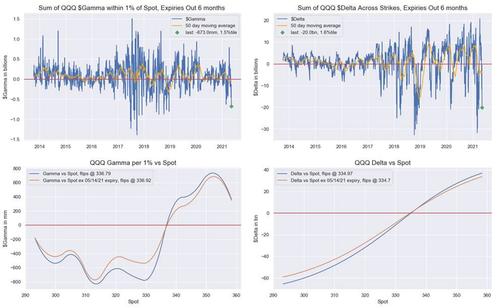
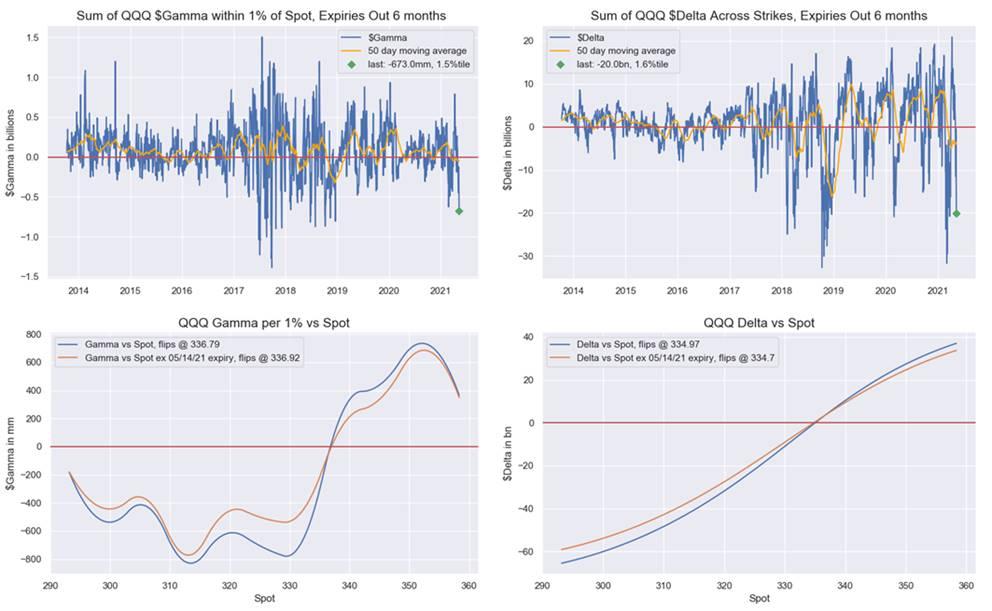
And that was exaggerated from a “flows” perspective by the previously warned-about deep Dealer “short Gamma vs spot” in QQQs we highlighted in recent notes as the center of Equities risk, which meant “accelerant” (delta hedging) flows into the selloff, with a now extremely negative $Gamma reading -$673mm (1.5%ile), while net Delta exploded lower to -$20B (1.6%ile).
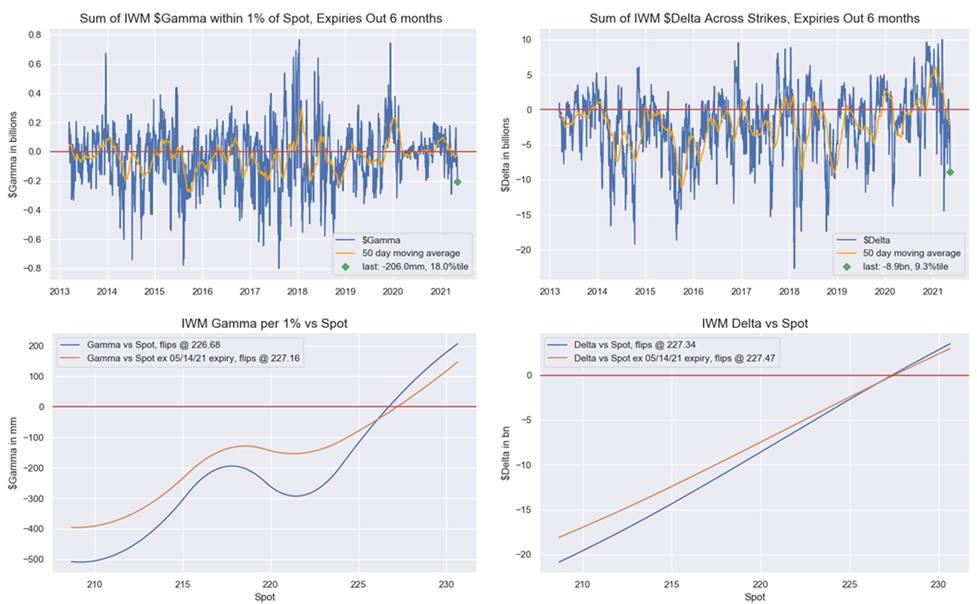
And Small Caps suffered the same as IWM options too showing Dealers DEEP “short Gamma vs spot” still (flips way up at 226.68) and overall $Gamma -206mm (18%ile), while $Delta is -$8.9B (9.3%ile) and negative until 227.34.

The question – amid this morning’s panic-bid in IWM and QQQ – is it over?
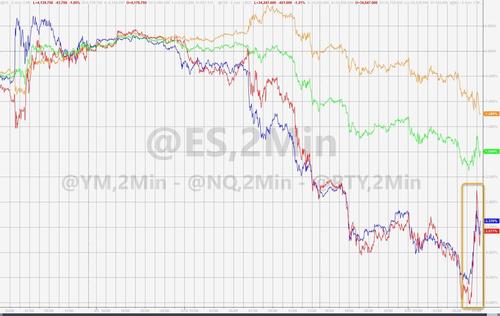
We suspect no, as that ARKK Gamma vicious circle doesn’t appear to be disappearing anytime soon.

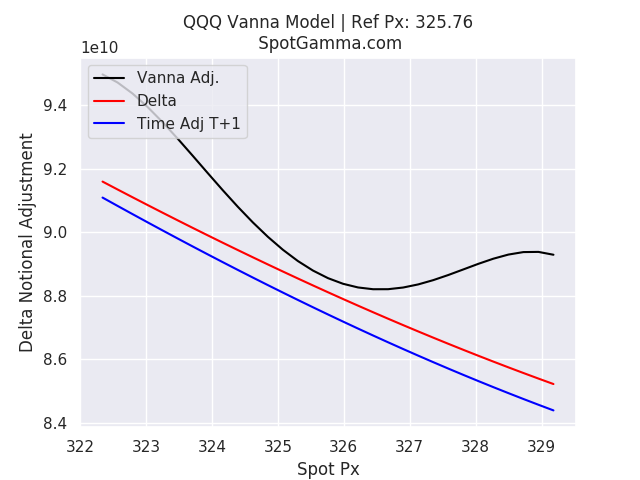
The dramatic rebound this morning is explained by just how much more “skew” there is in the QQQ model. 
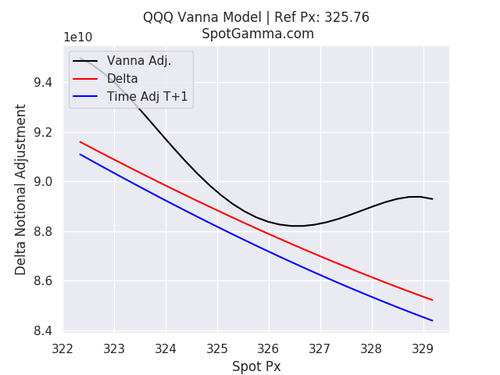
As SpotGamma explains, this supports that view of much larger volatility, both in dealers selling as Nasdaq moves lower and buying if Nasdaq rises.
Share This Article

  • Share
  • Twitter
  • LinkedIn
  • Reddit
  • Facebook

Written by SpotGamma · Categorized: Market Analysis · Tagged: ARKK, mcelligott, nomura

Don’t have an account with SpotGamma?

Choose the plan you want today to view unique support and resistance levels, access Founder’s Notes and expert commentary, daily trading ranges, and entrance into our private Discord.


Primary Sidebar

Related Resources

  • Options Exchange Monitor — Week of August 15, 2026 (36 SEC notices, 2 CFTC, 0 EDGAR)

    Options Exchange Monitor — Week of August 15, 2026 (36 SEC notices, 2 CFTC, 0 EDGAR)

    August 17, 2026
  • GEX Levels for SPY, QQQ, ES and NQ: Using Index Gamma in Any Product

    GEX Levels for SPY, QQQ, ES and NQ: Using Index Gamma in Any Product

    August 17, 2026
  • How to Trade GEX Levels: A Practical Guide to Gamma-Based Trading

    How to Trade GEX Levels: A Practical Guide to Gamma-Based Trading

    August 17, 2026
  • Free GEX Levels, Charts, and Data: What’s Available and What It’s Actually Worth

    Free GEX Levels, Charts, and Data: What’s Available and What It’s Actually Worth

    August 17, 2026
  • Covered Calls After Assignment: What to Do When the Stock Drops Below Your Cost Basis

    Covered Calls After Assignment: What to Do When the Stock Drops Below Your Cost Basis

    August 17, 2026
  • youtube
  • x
  • Privacy Policy
  • Disclaimer
  • Terms & Conditions
  • Support Center
  • Media
  • Contact Us

©2026 TenTen Capital LLC DBA SpotGamma

All SpotGamma materials, information, and presentations are for educational purposes only and should not be considered specific investment advice nor recommendations. Futures, foreign currency and options trading contains substantial risk and is not for every investor. An investor could potentially lose all or more than the initial investment. Risk capital is money that can be lost without jeopardizing one's financial security or lifestyle. Only risk capital should be used for trading and only those with sufficient risk capital should consider trading. Past performance is not necessarily indicative of future results. Testimonials appearing on this website may not be representative of other clients or customers and is not a guarantee of future performance or success.

View Full Risk Disclosure